The 2D Chart displays data supplied in a general layout. Data gets loaded into the six ChartDataArray objects, which take a type Object. Data can be loaded from pre-filled arrays or can be entered in at design time.
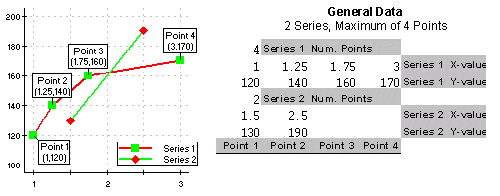
A General layout is used with every chart type. It contains an X and Y array, along with Y1, Y2, Y3, and Y4 arrays. All of these arrays can take data or can be null. For instance, to plot an XY chart with only one series, only the X and Y arrays would contain data. The other Y arrays would remain empty. In addition, unlike an array layout, each series can have a different number of points, and does not have to have matching X values which allows for charting as in the following image:
For convenience, a PointData property (an array of PointF structures) can also be used to supply X and Y data. The PointF values are not independent of the X and Y arrays, merely another form of data input and output. Changing values in the PointData property changes the X and Y arrays and vice versa.
The important General layout characteristics illustrated in the preceding image are the following: