To define custom point style condition the user must set Selection property of PointStyle to PointStyleSelectionEnum.Custom and provide event handler for the Select event. The following code creates a custom point style:
To write code in Visual Basic
| Visual Basic |
Copy Code
|
|---|---|
Private Sub Button1_Click(ByVal sender As System.Object, ByVal e As System.EventArgs)_ Handles Button1.Click
         ' create point style
        Dim ps As C1.Win.C1Chart.PointStyle = New C1.Win.C1Chart.PointStyle()
         ' custom point style
        ps.Selection = C1.Win.C1Chart.PointStyleSelectionEnum.Custom
        AddHandler ps.Select, AddressOf PS_Select
          ' add point style
        c1Chart1.ChartGroups(0).ChartData.PointStylesList.Add(ps)
End Sub
Private Sub PS_Select(ByVal sender As Object, ByVal e As _   C1.Win.C1Chart.PointStyleSelectEventArgs)
        Dim ps As C1.Win.C1Chart.PointStyle = CType(sender, C1.Win.C1Chart.PointStyle)
          ' set visual appearance depending on y value
        Dim ds As C1.Win.C1Chart.ChartDataSeries = _   c1Chart1.ChartGroups(0).ChartData(e.SeriesIndex)
        Dim y As Double = Convert.ToDouble(ds.Y(e.PointIndex))
        If (y < 0) Then
                ps.LineStyle.Color = Color.Blue
        Else
                ps.LineStyle.Color = Color.Red
        End If
          ' apply to all points
        e.Selected = True
End Sub
|
|
To write code in C#
| C# |
Copy Code
|
|---|---|
private void button1_Click(object sender, System.EventArgs e)
{
   // create point style
  C1.Win.C1Chart.PointStyle ps = new C1.Win.C1Chart.PointStyle();
   // custom point style
  ps.Selection = C1.Win.C1Chart.PointStyleSelectionEnum.Custom;
  ps.Select += new C1.Win.C1Chart.PointStyleSelectEventHandler(PS_Select);
   // add point style
  c1Chart1.ChartGroups[0].ChartData.PointStylesList.Add( ps);
}

private void PS_Select( object sender, C1.Win.C1Chart.PointStyleSelectEventArgs e)
{
        C1.Win.C1Chart.PointStyle ps = sender as C1.Win.C1Chart.PointStyle;
         // set visual appearance depending on y value
        C1.Win.C1Chart.ChartDataSeries ds = c1Chart1.ChartGroups[0].ChartData[e.SeriesIndex];
        double y = Convert.ToDouble( ds.Y[e.PointIndex]);
        if( y<0)
                ps.LineStyle.Color = Color.Blue;
        else
                ps.LineStyle.Color = Color.Red;
         // apply to all points
        e.Selected = true;
}
|
|
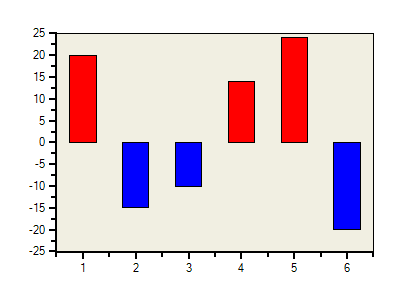
A custom blue point style is created for Y values less than zero and a custom red point style is created for y values greater than zero.