PointStyles can easily be created at design time through the PointStyle Collection Editor or programmatically through the PointStyle object.
PointStyles can be created at design time using the PointStyle Collection Editor. Using the collection editor, you may add, modify and remove point styles. For more information on the properties in the PointStyle Collection Editor, see PointStyle Collection Editor.
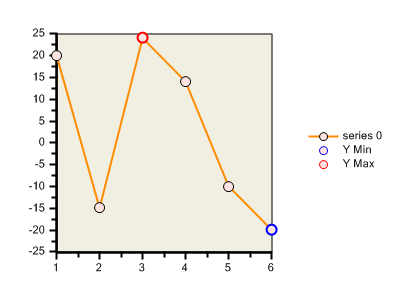
The following code creates an instance of PointStyle object and sets its LineStyle and SymbolStyle properties:
To write code in Visual Basic
| Visual Basic |
Copy Code
|
|---|---|
Dim styles As C1.Win.C1Chart.PointStylesCollection = _
 c1Chart1.ChartGroups(0).ChartData.PointStylesList

' min value
Dim psmin As C1.Win.C1Chart.PointStyle = styles.AddNewPointStyle()
psmin.LineStyle.Pattern = C1.Win.C1Chart.LinePatternEnum.None
psmin.SymbolStyle.Color = Color.MistyRose
psmin.SymbolStyle.OutlineColor = Color.Blue
psmin.SymbolStyle.OutlineWidth = 2
psmin.SymbolStyle.Size = 10
psmin.Selection = C1.Win.C1Chart.PointStyleSelectionEnum.SeriesMinY

' show in legend
psmin.Label = "Y Min"
psmin.LegendEntry = True

' max value
Dim psmax As C1.Win.C1Chart.PointStyle = styles.AddNewPointStyle()
psmax.LineStyle.Pattern = C1.Win.C1Chart.LinePatternEnum.None
psmax.SymbolStyle.Color = Color.MistyRose
psmax.SymbolStyle.OutlineColor = Color.Red
psmax.SymbolStyle.OutlineWidth = 2
psmax.SymbolStyle.Size = 10
psmax.Selection = C1.Win.C1Chart.PointStyleSelectionEnum.SeriesMaxY

' show in legend
psmax.Label = "Y Max"
psmax.LegendEntry = True
c1Chart1.Legend.Visible = True
|
|
To write code in C#
| C# |
Copy Code
|
|---|---|
C1.Win.C1Chart.PointStylesCollection styles = c1Chart1.ChartGroups[0].ChartData.PointStylesList;

// min value
C1.Win.C1Chart.PointStyle psmin = styles.AddNewPointStyle();
psmin.LineStyle.Pattern = C1.Win.C1Chart.LinePatternEnum.None;
psmin.SymbolStyle.Color = Color.MistyRose;
psmin.SymbolStyle.OutlineColor = Color.Blue;
psmin.SymbolStyle.OutlineWidth = 2;
psmin.SymbolStyle.Size = 10;
psmin.Selection = C1.Win.C1Chart.PointStyleSelectionEnum.SeriesMinY;

// show in legend
psmin.Label = "Y Min";
psmin.LegendEntry = true;

// max value
C1.Win.C1Chart.PointStyle psmax = styles.AddNewPointStyle();
psmax.LineStyle.Pattern = C1.Win.C1Chart.LinePatternEnum.None;
psmax.SymbolStyle.Color = Color.MistyRose;
psmax.SymbolStyle.OutlineColor = Color.Red;
psmax.SymbolStyle.OutlineWidth = 2;
psmax.SymbolStyle.Size = 10;
psmax.Selection = C1.Win.C1Chart.PointStyleSelectionEnum.SeriesMaxY;

// show in legend
psmax.Label = "Y Max";
psmax.LegendEntry = true;
c1Chart1.Legend.Visible = true;
|
|
PointStyles are added to the data points for the first series of C1Chart. Two special point styles are also added to represent the minimum and maximum value points for the Y-axis.