At times, it is very convenient to use string values as annotations along the X or Y axes, and numeric values along the other axis.
For example, suppose a data source contains 2 columns, one with a company name (string), and one with the number of ComponentOne products purchased by that company. To create a bar chart summarizing this data, one might create a series that uses the number of products on the Y axis, and then create an array with counting numbers and use this array for the X values. Then, create ValueLabels for the X axis, pairing each company name with a count number, thus producing a chart similar to the following:
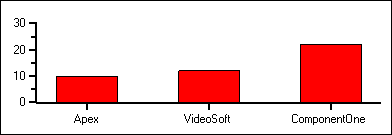
Since this situation occurs often, C1Chart accepts ChartDataArray with strings, which automatically enumerates the array values and creates ValueLabels for the appropriate axis. Using this behavior, it is possible (and very convenient) to set the DataField properties for a ChartDataSeries to the string values directly and get the same results:
To write code in Visual Basic
| Visual Basic |
Copy Code
|
|---|---|
C1Chart1.ChartGroups(0).ChartData.SeriesList(0).X.DataField = "CompanyNames" C1Chart1.ChartGroups(0).ChartData.SeriesList(0).Y.DataField = "UnitsPurchased" |
|
To write code in C#
| C# |
Copy Code
|
|---|---|
c1Chart1.ChartGroups[0].ChartData.SeriesList[0].X.DataField = "CompanyNames"; c1Chart1.ChartGroups[0].ChartData.SeriesList[0].Y.DataField = "UnitsPurchased"; |
|