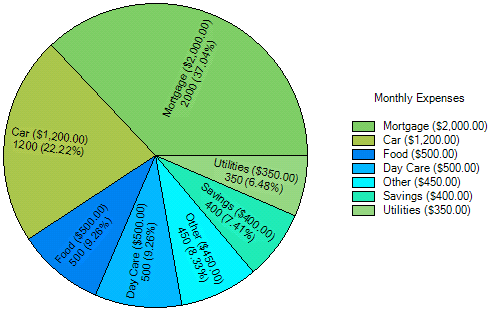
To represent the sum of all series at a given point in a Pie chart, use the {%YVAL} like in the following example:
To write code in Visual Basic
| Visual Basic |
Copy Code
|
|---|---|
Private Sub Form1_Load(ByVal sender As System.Object, ByVal e As System.EventArgs) Handles MyBase.Load

        ' use light colors so all of the labels are easily read.
        C1Chart1.ColorGeneration = ColorGeneration.Flow

        ' maximize the ChartArea
        C1Chart1.ChartArea.Margins.SetMargins(0, 0, 0, 0)
        C1Chart1.ChartArea.Style.Border.BorderStyle = BorderStyleEnum.None
        ' Set chart type
        C1Chart1.ChartArea.Inverted = True
        C1Chart1.ChartGroups(0).ChartType = C1.Win.C1Chart.Chart2DTypeEnum.Pie
        ' Clear previous data
        C1Chart1.ChartGroups(0).ChartData.SeriesList.Clear()
        ' Add Data

        Dim ProductNames As String() = {"Mortgage", "Car", "Food", "Day Care", "Other", "Savings", "Utilities"}
        Dim PriceX As Integer() = {2000, 1200, 500, 500, 450, 400, 350}

        'get series collection
        Dim dscoll As ChartDataSeriesCollection = C1Chart1.ChartGroups(0).ChartData.SeriesList
        'populate the series
         For i As Integer = 0 To PriceX.Length - 1
                Dim series As ChartDataSeries = dscoll.AddNewSeries()
                'Assign the prices to the Y Data series
                series.Y(0) = PriceX(i)
                'format the product name and product price on the legend

                series.Label = String.Format("{0} ({1:c})", ProductNames(i), PriceX(i))
                series.DataLabel.Text = "{#TEXT}" & vbCr & vbLf & "{#YVAL} ({%YVAL:%})"
                series.DataLabel.Compass = LabelCompassEnum.RadialText
                series.DataLabel.Offset = -5
                series.DataLabel.Visible = True
        Next
        ' show pie Legend
        C1Chart1.Legend.Visible = True
        'add a title to the chart legend
        C1Chart1.Legend.Text = "Monthly Expenses"
End Sub
|
|
To write code in C#
| C# |
Copy Code
|
|---|---|
private void Form1_Load(object sender, EventArgs e)
    {
        // use light colors so all of the labels are easily read.
        c1Chart1.ColorGeneration = ColorGeneration.Flow;

        // maximize the ChartArea
        c1Chart1.ChartArea.Margins.SetMargins(0, 0, 0, 0);
        c1Chart1.ChartArea.Style.Border.BorderStyle = BorderStyleEnum.None;
        // Set chart type
        c1Chart1.ChartArea.Inverted = true;
        c1Chart1.ChartGroups[0].ChartType = C1.Win.C1Chart.Chart2DTypeEnum.Pie;
        // Clear previous data
        c1Chart1.ChartGroups[0].ChartData.SeriesList.Clear();
        // Add Data

        string[] ProductNames = { "Mortgage", "Car", "Food", "Day Care", "Other", "Savings","Utilities" };
        int[] PriceX = {2000, 1200, 500, 500, 450, 400, 350 };

        //get series collection
        ChartDataSeriesCollection dscoll = c1Chart1.ChartGroups[0].ChartData.SeriesList;
        //populate the series
        for (int i = 0; i < PriceX.Length; i++)
        {
            ChartDataSeries series = dscoll.AddNewSeries();
            //Add one point to show one pie
            series.PointData.Length = 1;
            //Assign the prices to the Y Data series
            series.Y[0] = PriceX[i];
            //format the product name and product price on the legend
            series.Label = string.Format("{0} ({1:c})", ProductNames[i], PriceX[i]);
            series.DataLabel.Text = "{#TEXT}\r\n{#YVAL} ({%YVAL:%})";
            series.DataLabel.Compass = LabelCompassEnum.RadialText;
            series.DataLabel.Offset = -5;
            series.DataLabel.Visible = true;
        }
        // show pie Legend
        c1Chart1.Legend.Visible = true;
        //add a title to the chart legend
        c1Chart1.Legend.Text = "Monthly Expenses";
    }
|
|
The data labels represent the point value and percentage of each slice or point on the Pie chart: