A frequency chart is a histogram without the columns. The midpoint of each column is connected by a straight or curved (spline) line. As a result, the columns are eliminated. In C1Chart, the connecting lines from one midpoint of a column to another midpoint of a column can be lines or spline fits. A frequency chart is beneficial when you are comparing multiple data series since it makes the data easier to read.
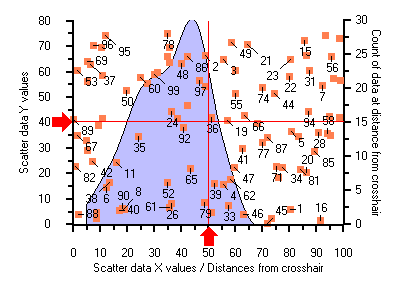
The frequency graph below illustrates the distribution (in distance) from all the data coordinates from each of the scatter data points to the marker intersection. The numbers associated with the scatter data points are point index values.
You can set the connected lines in the Frequency chart to straight by setting the FitType property to Line. Alternatively, curved lines can be obtained with a FitType of Spline. The advantage of a frequency graphic is that it shows the important features of the distribution without the distraction at the corners. The following code shows the FitType property set to Spline for the Frequency graph:
To write code in Visual Basic
| Visual Basic |
Copy Code
|
|---|---|
cds.FitType = FitTypeEnum.Spline |
|
To write code in C#
| C# |
Copy Code
|
|---|---|
cds.FitType = FitTypeEnum.Spline; |
|
The following Frequency graph is the same as the preceding graph except it includes a normal curve to compare the distance distribution with the normal distance distribution. With the normal curve shown we can evaluate whether the raw data is a reasonable approximation to the normal distribution. The raw data's labels are hidden to provide a clearer picture of both curves.
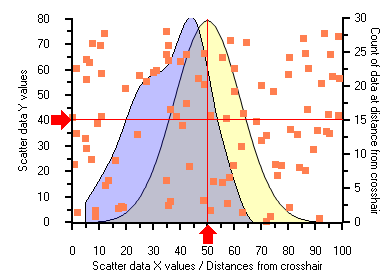
The Histogram object in Chart provides a NormalDisplay property to get the (Gaussian) Normal curve to display. You can access this property at design time in the C1Chart's properties grid by expanding the Histogram node and setting the NormalDisplay property to C1.Win.C1Chart.NormalCurve. Another alternative is to access the NormalDisplay property by using the following code:
To write code in Visual Basic
| Visual Basic |
Copy Code
|
|---|---|
Dim nc As NormalCurve = cg.Histogram.NormalDisplay |
|
To write code in C#
| C# |
Copy Code
|
|---|---|
NormalCurve nc = cg.Histogram.NormalDisplay; |
|