When data is obtained in arrays of specific length, programming is often simplified when all the arrays can be handled uniformly, even if some of the data points are missing and it is not desired to indicate the missing data. In this case, Data Holes can still be used as values for the missing data and C1Chart can simply ignore them entirely, as if those data array elements containing the Data Hole did not exist at all.
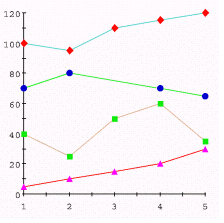
The Display property of the ChartDataSeries sets the display properties for a series. This property accepts a SeriesDisplayEnum enumeration. If the Display property is set to SeriesDisplayEnum.Show, then the Data Hole will be excluded from the plot as in the image above. If this property is set to SeriesDisplayEnum.ExcludeHoles the series will be displayed, but the holes will be ignored. This means that if an XY-Plot is being displayed, the line will continue from the point previous to the Data Hole directly to the point after the Data Hole as in the image below. Notice that although the plot line continues past the Data Hole, the Data Hole point is not charted.
SeriesDisplayEnum.Show
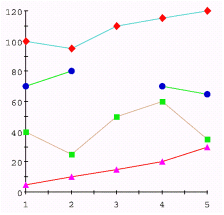
SeriesDisplayEnum.ExcludeHoles