When a data set contains X or Y values which span a large range, sometimes the normal chart setup does not display the information most effectively. Formatting a chart with a vertical Y-axis and axis annotation that begins at the minimum value can sometimes be more visually appealing if the chart could be inverted or the axes reversed. Therefore, C1Chart provides the Inverted property of the ChartArea and the Reversed property of the axis.
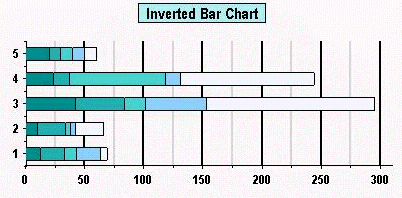
Setting the Inverted property of the ChartArea to True will invert the axes. This means that the X-axis will take the place of the Y-axis, and the Y-axis will take the place of the X-axis. Initially the chart is setup with the X-axis displayed horizontally and the Y-axis displayed vertically. This feature is commonly used in Bar Charts.
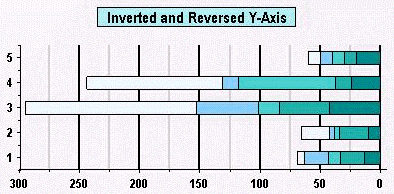
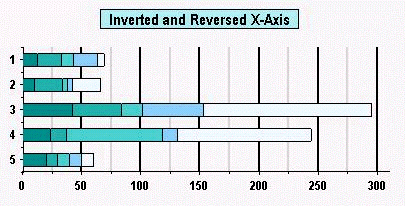
Setting the Reversed property of the ChartArea to True will reverse the axes. This means that the Max side of the axis will take the place of the Min side of the axis, and the Min side of the axis will take the place of the Max side of the axis. Initially, the chart displays the Minimum value on the left side of the X-axis, and on the bottom side of the Y-axis. Setting the Reversed property of the Axis, however will juxtapose these Maximum and Minimum values.