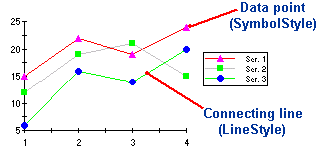
Line and XY-Plot charts draw each series as connected points of data. By customizing Line and Symbol Styles for each series, the connecting lines can be removed to emphasize the data values themselves, or the points can be removed to emphasize the relationship between points. The series can be drawn independently or stacked. The line and symbol properties for each series can also be customized. For more information, see Line and Symbol Styles for the Series.
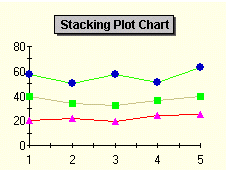
Use the ChartGroup object's Stacked property to create a stacking Plot chart. Stacking charts represent the data by stacking the values for each series on top of the values from the previous series.