For charts that contain plot lines (XY-Plot, Area, Polar, and Radar), the FitType property sets how the line fits to the points of the chart. The property takes a FitTypeEnum enumeration.
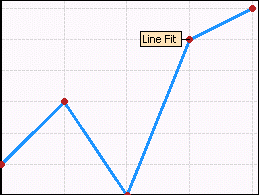
The Line fit is the default fit for the plot lines that is where the line travels directly from point to point. The Line fit is illustrated below.
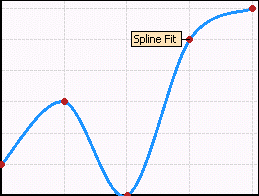
The Spline fit is where the line is curved to still pass through the plots, but provide a smooth curved plot line nonetheless. Those familiar with how curved lines are created in most drawing applications will likely be familiar with the Spline fit type.
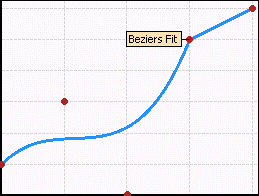
The Beziers fit is where the line does not necessarily pass through all data points, but the points act as magnets, pulling the curve in certain directions and influencing the way the curve bends.