Modify the X and Y Axis Appearance using the Properties Window
In This Topic
To modify the X and Y Axis appearance using the C1Chart Properties window, complete the following steps:
- Right-click on the C1Chart control and select Properties from the context menu. The Properties window for the C1Chart control will appear in the right pane.
- Expand the ChartArea node and then expand AxisX.
- Click on the dropdown arrow next to the ForeColor property and select Green from the Custom tab.
- Expand the AxisY node and Click on the dropdown arrow next to the ForeColor property and select Green from the Custom tab.
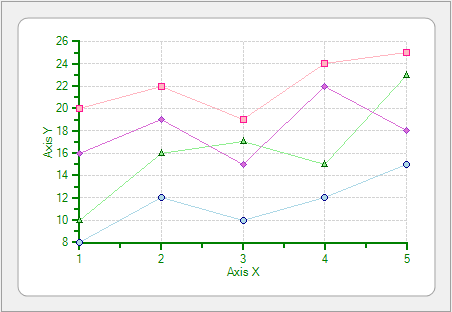
The X and Y axes forecolor are modified to green.
See Also