This section provides step-by-step instructions for building a Pie Chart. A Pie chart is used to display simple values. Unlike other C1Chart types, the Pie chart must have more than one series in order to display multiple slices. If there was only one series the Pie would just be a cirlce without any slices. In this example we will create a pie with eight slices so we will have eight series with a single point each as opposed to a single series with eight points in it.
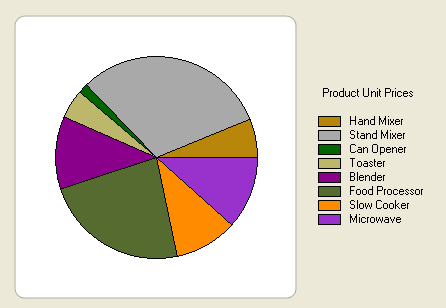
The graph shows the information as a Pie chart with each product representing one slice of the pie.
Both steps are shown below for creating the Pie chart at design time or programmatically through the Chart objects.
To create a Pie chart at design time
This task assumes you have already added the C1Chart control to the form.
The first step in configuring a chart through the Chart Properties designer is to select a gallery type from the available chart types.
The default Pie will add five pies with each having four data series.
A warning will appear to remind you that you must add data to the new series.
To enable the legend, select Legend under Appearance in the Chart Properties designer treeview pane and select the Legend checkbox.
To create a Pie chart programmatically
This task assumes you have already added the C1Chart control to the form.
To write code in Visual Basic
| Visual Basic |
Copy Code
|
|---|---|
Imports C1.Win.C1Chart; |
|
To write code in C#
| C# |
Copy Code
|
|---|---|
using C1.Win.C1Chart; |
|
To write code in Visual Basic
| Visual Basic |
Copy Code
|
|---|---|
Private Sub Form1_Load(ByVal sender As System.Object, ByVal e As System.EventArgs) Handles MyBase.Load

        ' Set chart type
        C1Chart1.ChartArea.Inverted = True
        C1Chart1.ChartGroups(0).ChartType = C1.Win.C1Chart.Chart2DTypeEnum.Pie

        ' Clear previous data
        C1Chart1.ChartGroups(0).ChartData.SeriesList.Clear()

        ' Add Data
        Dim ProductNames As String() = {"Hand Mixer", "Stand Mixer", "Can Opener", "Toaster", "Blender", "Food Processor", "Slow Cooker", "Microwave"}
        Dim PriceX As Integer() = {80, 400, 20, 60, 150, 300, 130, 500}

        'get series collection
        Dim dscoll As ChartDataSeriesCollection = C1Chart1.ChartGroups(0).ChartData.SeriesList
        For i As Integer = 0 To PriceX.Length - 1
                'populate the series
                Dim series As ChartDataSeries = dscoll.AddNewSeries()
                'Add one point to show one pie
                series.PointData.Length = 1
                'Assign the prices to the Y Data series
                series.Y(0) = PriceX(i)
                'format the product name and product price on the legend
                series.Label = String.Format("{0} ({1:c})", ProductNames(i), PriceX(i))
        Next

        ' show pie Legend
        C1Chart1.Legend.Visible = True
        'add a title to the chart legend
        C1Chart1.Legend.Text = "Product Unit Prices"
End Sub
|
|
To write code in C#
| C# |
Copy Code
|
|---|---|
private void Form1_Load(object sender, EventArgs e)
{

        // Set chart type
        c1Chart1.ChartArea.Inverted = true;
        c1Chart1.ChartGroups[0].ChartType = C1.Win.C1Chart.Chart2DTypeEnum.Pie;

        // Clear previous data
        c1Chart1.ChartGroups[0].ChartData.SeriesList.Clear();

        // Add Data
        string[] ProductNames = { "Hand Mixer", "Stand Mixer", "Can Opener", "Toaster" ,"Blender" ,"Food Processor" ,"Slow Cooker" ,"Microwave"};
        int[] PriceX = { 80, 400, 20, 60, 150, 300, 130, 500 };

        //get series collection
        ChartDataSeriesCollection dscoll = c1Chart1.ChartGroups[0].ChartData.SeriesList;

        //populate the series
        for (int i=0; i < PriceX.Length; i++)
        {
                ChartDataSeries series = dscoll.AddNewSeries();
                //Add one point to show one pie
                series.PointData.Length = 1;
                //Assign the prices to the Y Data series
                series.Y[0] = PriceX[i];
                //format the product name and product price on the legend
                series.Label = string.Format("{0} ({1:c})", ProductNames[i], PriceX[i]);
        }

        // show pie Legend
        c1Chart1.Legend.Visible = true;

        //add a title to the chart legend
        c1Chart1.Legend.Text = "Product Unit Prices";
}
|
|