A Polar chart draws the x and y coordinates in each series as (theta,r), where theta is amount of rotation from the origin and r is the distance from the origin. Theta may be specified in either degrees (default) or radians. Since the X-axis is a circle, the X-axis maximum and minimum values are fixed. The series can be drawn independently, or stacked.
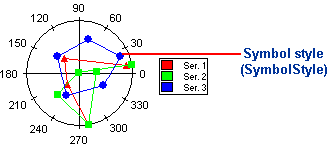
Using the LineStyle and SymbolStyle, the line and symbol properties of each series can be customized. For more information, see Line and Symbol Styles for the Series.
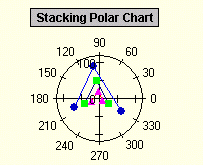
Use the ChartGroup object's Stacked property to create a stacking Polar chart. Stacking charts represent the data by stacking the values for each series on top of the values from the previous series.