For logarithmic axis scaling, UnitMajor is taken as a multiplier of the base value of each cycle that provides a hint as to the annotation spacing within each cycle of the logarithmic base. That is (UnitMajor * base cycle value) is approximately the annotation value increment within each cycle. For integer logarithmic base values, the result is usually exact. For floating point values, annotations are rounded to nice numbers as for linear scaling.
Often, when logarithmic scales are used, the bounds of a chart axis will span multiple cycles of the logarithmic base. In these cases, the usual linear specification of UnitMajor no longer makes sense, as a value appropriate for a given cycle makes little sense for the previous or next cycles. For the UnitMajor setting to be of value, it must pertain to values relative to each cycle of the logarithmic base.
If this doesn't make sense to you, think about what single, fixed, incremental value you might use for the following axis:
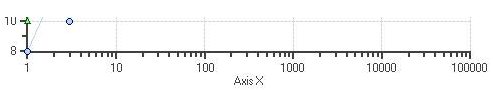
Following the above reasoning, for logarithmic axes, the chart assumes that UnitMajor specifies the fraction of the base value for each cycle. Consider the following examples:
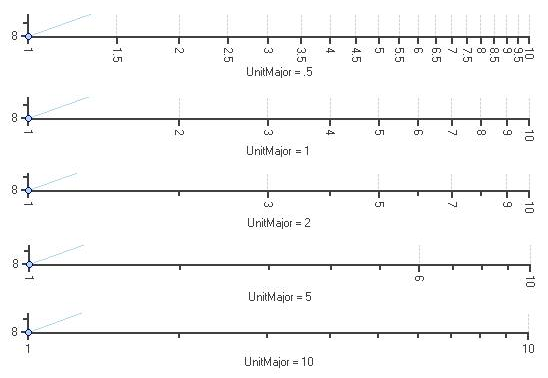
In each case, the base cycle value is 1. For each cycle the next annotation value = previous number + (base value of cycle * UnitMajor). The maximum value of the UnitMajor is the LogarithmicBase. The automatic value of UnitMajor is always the LogarithmicBase.
When all of the annotation values are calculated, a nice rounding algorithm is applied so the numbers are relatively easy to read. The behavior may seem a bit odd, but it is the result of accommodating any logarithmic base while at the same time obtaining numbers for the annotations that are reasonable to read.
For example, the plots above are log-base 10 values, but there are also natural-logs to consider such as log-base 2, log-base-x, etc.