The Visual Effects designer consists of a Presets, Colors, and Parameters tab.
The Presets tab appears like the following:
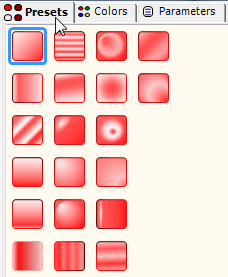
The Presets tab contains a list of built-in settings for the available Chart2D elements. This makes it simple to visually enhance one or all of the available Chart2D elements with one simple click.
The Colors tab appears like the following:
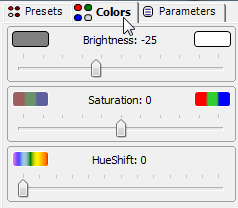
The Colors tab page includes a slider for the color's brightness, saturation, and hue shift. Brightness, Saturation, and Hue represent the red, blue, and green color scheme. This makes it possible to achieve any type of color tone you want for the chart element by changing its brightness and saturation rather than limiting you from specific colors. You can even change all of the colors using the HueShift slider. For more information on using the color slider for chart elements, see Use the Color Sliders to Enhance an Existing Color for the Chart Data Series or Use the Color Sliders to Enhance an Existing Color for the Chart Header and Footer.
Brightness Slider
The brightness is the lightness or darkness of a tone. To increase the level of lightness, slide the Brightness slider to the right. To decrease the level of lightness, slide the Brightness slider to the left.
Saturation Slider
Saturation is the intensity of a hue from gray tone to pure vivid tone. The values in the Saturation slider range from -100 to 100 with the lowest value representing no saturation (a gray tone) to the highest value 100 representing high saturation (pure tone).
To make the color more bright and intense, move the Saturation slider to the right. The color intensity increases the further you slide the Saturation slider to the right.
To make the color dull, move the Saturation slider to the left. The color intensity decreases the further you slide the Saturation slider to the left.
HueShift Slider
Hue represents the specific tone of the color wheel. The value of the Hue depends on the values of the brightness and saturation. If there is high saturation, but no brightness (value of 0) the Hue tone appears grayish-black. If there is high brightness, but no saturation, the Hue tone appears opaque/white.
The Parameters tab appears like the following:
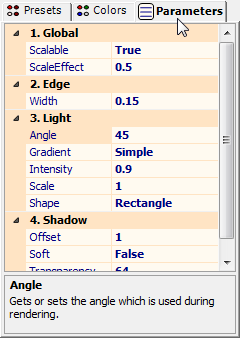
The Parameters tab includes properties for the Chart2D elements scaling, edge, light, and shadow effects. With these properties you have endless possibilities in customizing your chart's elements. For more information on these properties, see Visual Effects Parameters.