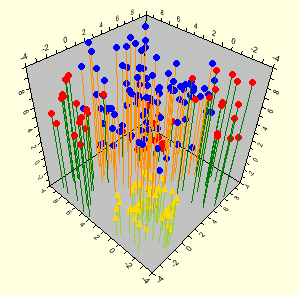
The 3D Scatter plots consist of one or more series of individual points. They show a relationship between three or more variables which represent the X, Y, and one or more Z coordinates of each point. To create a better display of the 3D Scatter plot, you can add drop lines between the plotted points and the origin like shown in the following image:
To write code in Visual Basic
| Visual Basic |
Copy Code
|
|---|---|
C1Chart3D1.ChartGroups(0).ChartType = Chart3DTypeEnum.Scatter |
|
To write code in C#
| C# |
Copy Code
|
|---|---|
C1Chart3D1.ChartGroups[0].ChartType = Chart3DTypeEnum.Scatter; |
|