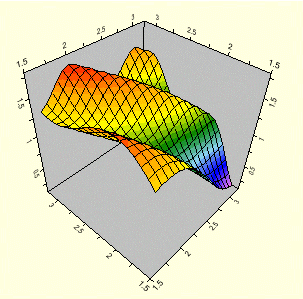
The 3D Surface charts display the data as three dimensional shaded or meshed surface with a Z-axis. They are based on X, Y, and Z axes, with more variation in the Z variable than the X or Y variables. The shaded or meshed surface is created from the information collected on how the data points are connected. The surface between data points can be estimated through interpolation.
To write code in Visual Basic
| Visual Basic |
Copy Code
|
|---|---|
C1Chart3D1.ChartGroups(0).ChartType = Chart3DTypeEnum.Surface |
|
To write code in C#
| C# |
Copy Code
|
|---|---|
C1Chart3D1.ChartGroups[0].ChartType = Chart3DTypeEnum.Surface; |
|