A very flexible type of annotation, ValueLabels displays text defined at a specific axis coordinate. This is useful to label only specific coordinates, or to produce annotation in a form that the chart does not provide. ValueLabels annotation can be used for any axis.
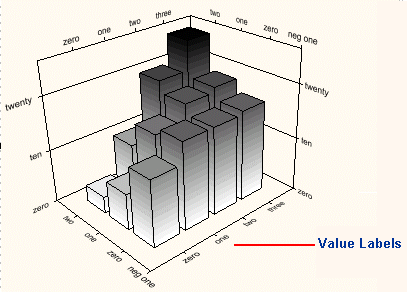
Every label displayed on the axis is one ValueLabel. Each ValueLabel has a Value property and a Text property.
Use the Value property to set the axis coordinate to display the label. Use the Text property to specify the text to display. All ValueLabels properties are located on the Chart3DLabel Collection Editor, which can be accessed by:
Set AnnoMethod to ValueLabels for an axis and use this editor to define the labels.