To write code in Visual Basic
| Visual Basic |
Copy Code
|
|---|---|
' 1 step
' Create dataset with sample data
Dim rnd As Random = New Random()
Dim i, j As Integer
Dim z(20, 20) As Double
For i = 0 To 20
  For j = 0 To 20
    z(i,j) = 200 - ((i - 10) * (i - 10) + (j - 10) * (j - 10))
  Next j
Next i
Dim gridset As Chart3DDataSetGrid = New Chart3DDataSetGrid(0, 0, 1, 1, z)
C1Chart3D1.ChartGroups(0).ChartData.Set = gridset

' 2 step
' Create 4-dimension values array and put it to the chart
Dim contour(20, 20) As Double
For i = 0 To 20
  For j = 0 To 20
    contour(i, j) = rnd.NextDouble()
  Next j
Next i
C1Chart3D1.ChartGroups(0).ChartData.ContourData = contour

' 3 step
' Set zoned chart
C1Chart3D1.ChartGroups(0).Contour.IsZoned = True
C1Chart3D1.ChartGroups(0).Contour.NumLevels = 20
C1Chart3D1.ChartGroups.ContourStyles.ColorSet = ColorSetEnum.RevRainbow
|
|
To write code in C#
| C# |
Copy Code
|
|---|---|
// 1 step
// Create dataset with sample data
Random rnd = new Random();
int i, j;
double[,] z = new double[21, 21];
for( i=0; i<z.GetLength(0); i++)
{
  for( j=0; j<z.GetLength(1); j++)
  {
    z[ i, j] = 200 - (( i-10)*(i-10) +  (j-10)*(j-10));
  }
}
Chart3DDataSetGrid gridset=new Chart3DDataSetGrid(0,0,1,1,z);
C1Chart3D1.ChartGroups[0].ChartData.Set = gridset;

// 2 step
// Create 4-dimension values array and put it to the chart
double[,] contour = new double[21, 21];
for( i=0; i<contour.GetLength(0); i++)
{
  for( j=0; j<contour.GetLength(1); j++)
  {
    contour[ i, j] = rnd.NextDouble();
  }
}
C1Chart3D1.ChartGroups[0].ChartData.ContourData = contour;

// 3 step
// Set zoned chart
C1Chart3D1.ChartGroups[0].Contour.IsZoned = true;
C1Chart3D1.ChartGroups[0].Contour.NumLevels = 20;
C1Chart3D1.ChartGroups.ContourStyles.ColorSet = ColorSetEnum.RevRainbow;
|
|
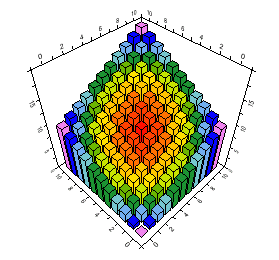
In Bar charts, each bar is displayed as a single solid color according to the zoned height of the bar:
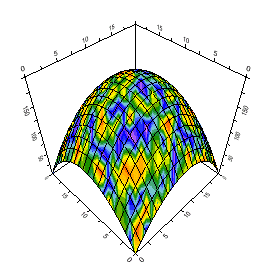
In Surface charts, the fourth dimension is displayed as zoning and contouring colors.