In This Topic
Chart for WinForms includes the following features for the C1Chart3D component:
- 100% managed code
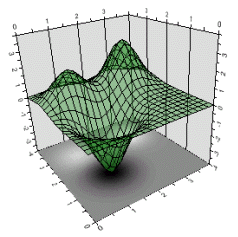
- Surface, Bar, and Scatter charts provide various ways to display data
- Automatically generates contours and zones from the data
The C1Chart3D control automatically generates contours and zones and assigns contour styles to each contour from the 100 built-in styles. For more information on contours and zones, see Contour and Zoned Charts.
- Interactive viewing allows both the programmer and the end user to utilize chart rotation, shift, and zoom.
- Transparent data plotting
Create transparency in your data drawing using the Transparency property.
- 4D charts capability
C1Chart3D enables developers to represent four-dimensional plots and Bar charts using color as the fourth dimension. 4D charts are useful for visualizing two sets of identically sized data in one chart.
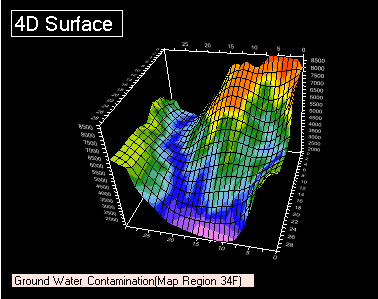
For more information on how to create 4D charts, see Creating 4D Charts.
- Advanced mouse tracking capabilities to keep track of the region, series, or data point under the mouse pointer
Provides a set of conversion methods that when used in conjunction with .NET's MouseMove event allow the programmer to keep track of the chart's region, series, or data point under the mouse pointer. This makes it easier to create interesting application specific features like handling a double-click in the legend, or chart tool tips.
- Image generation: Charts can be saved to any number of image formats (metafile, BMP, JPG, and more).
- SmartDesigner provides highly-interactive chart building capabilities
Save substantial time using Chart's SmartDesigner, which handles everyday tasks in chart placement. Accomplish tasks without leaving the design form; each chart element reveals built-in toolbars and editors with the click of your mouse pointer.
For more information on the SmartDesigner, see Working with the Smart Designer.
- Novice users can create a 3D chart in three simple steps with the Chart3D Wizard
The Chart3D Wizard walks beginners through the steps of creating a new 3D chart from start to finish: choose the chart type; select the type of data layout: regular grid, irregular grid, or point layout; and edit the chart's 3D view such as rotate the x-axis, change the chart's perspective, or sclae it.
For more information on the Chart3D Wizard, see Working with the Chart3D Wizard.
- You no longer have to tirelessly scroll through the Propertes window to create a chart
C1Chart3D places the chart elements in an organized Chart Properties designer so you can quickly address chart details. Create or modify existing charts, select the type of data layout: regular grid, irregular grid, or point layout; and edit the chart's 3D view such as rotate the x-axis, change the chart's perspective, or sclae it.
For more information on the Chart3D Properties designer, see Working with the Chart3D Properties designer.
- Invert axes using one property
Enables you to invert the X and Y axis using one simple property.
- Highly interactive behavior at run time drives up value in chart use
C1Chart provides interactive built-in tools for rotation, scaling, and zooming. Using these tools, you can build highly-interactive charts for your users.
- C1Chart provides flexible image formats for chart rendering
Charts can be saved to any number of image formats (metafile, BMP, JPG, and more).
See Also