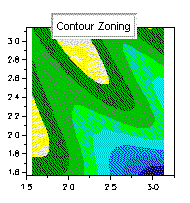
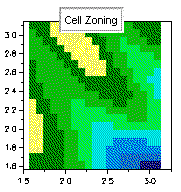
Use the ZoneMethod property of the Chart3DContour object to specify how to determine each zone region. Contour zoning uses the contour intervals for each zone region, while cell zoning uses the rectangular block formed by the X/Y grid. Cell zoning produces a coarser-looking surface but redraws significantly faster than contour zoning. ZoneMethod can be accessed at design time through the Contour node, which is located in the ChartGroup Collection Editor in the Visual Studio Properties window.
 |
 |