In This Topic
This quick start will guide you through the steps of adding control to create a simple dashboard application. Follow the steps below to get started:
- Setting up the application
- Create a data source for DashboardLayout
- Add controls to DashboardLayout
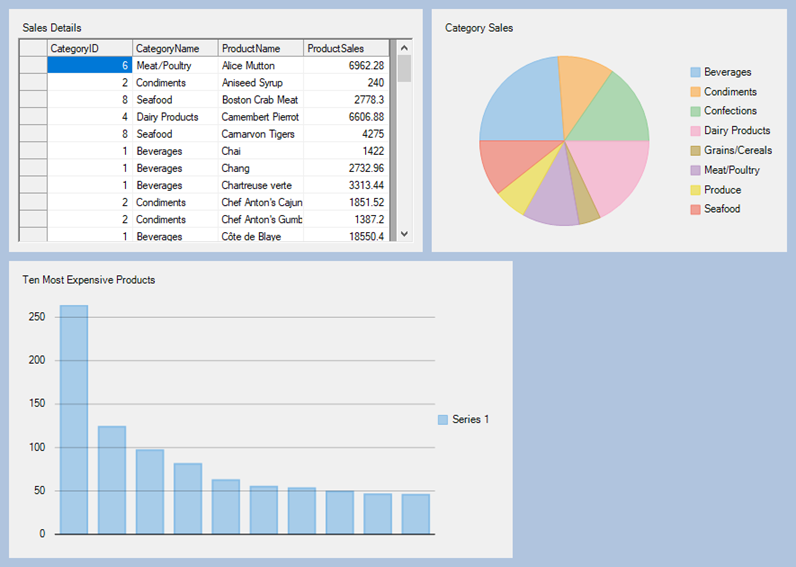
The following image shows a dashboard created using the C1DashboardLayout control.
Step 1: Setting up the application
- Create a new Windows Forms App.
- Drag and drop the C1DashboardLayout control from the Toolbox onto the form.
Observe: By default, a layout of the type Split is attached to it.
- In the Properties window, set the following properties.
| Property |
Value |
|
LayoutType
|
Flow
|
|
Dock
|
Fill
|
|
Styles > Common > Padding
|
5
|
|
Styles > ItemContainer > Margins
|
5
|
- Click inside the DashboardLayout control. The FlowContentPanel (layout control attached to the DashboardLayout) is selected.
Observe: By default, the FlowContentPanel contains two child containers named Panel1 and Panel3 of the type Panel. Panel1 positions itself at the upper left corner of the FlowContentPanel since its FlowDirection property is set to LeftToRight by default and Panel3 positions itself next to Panel1, maintaining the default LeftToRight flow direction as the width of C1DashboardLayout has not yet exhausted.
Back to Top
Step 2: Create a data source for DashboardLayout
- Go to the Project menu and select Add New Data Source from the Project dropdown menu.
The Data Source Configuration Wizard dialog box appears.
- Select Database and click Next.
- Select Dataset and click Next.
- Click New Connection.
- Select Data source as Microsoft Access Database File (OLEDB).
- Click Browse to add a database file name as C1NWind.mdb by navigating to its default location,
C:\Users\Documents\ComponentOne Samples\Common.
- Select C1NWind database, click Open, and then click OK.
- Click the Next button to continue. A dialog box appears asking if you would like to add the data file to your project and modify the connection string. Since it is not necessary to copy the database to your project, click No.
- Verify that Yes, save the connection as check box is checked and click Next to continue. The connection string is saved as C1NwindConnectionString.
- Expand the Views node and select Category Sales for 2014, Sales by Category and Ten Most Expensive Products objects.
- Click Finish.
Observe: C1NwindDataSet.xsd is added to your project.
Back to Top
Step 3: Add controls to DashboardLayout
- Select Panel1 and set the following properties.
| Property |
Value |
| Size |
460, 270 |
| Caption on c1DashboardLayout1 |
Sales Details |
- Drag and drop the C1FlexGrid control on Panel1. Navigate to DataSource property of the FlexGrid control and select C1NwindDataSet to bind the control to the data source.
Observe: A binding source gets created and the DataSource property is set to c1NwindDataSetBindingSource.
- Set the following properties of the C1FlexGrid control from the Properties window.
| Property |
Value |
| Dock |
Fill |
| DataMember |
Sales by Category |
- Select Panel3 and set the following properties.
| Property |
Value |
| Size |
395, 270 |
| Caption on c1DashboardLayout1 |
Category Sales |
- Drag and drop a FlexPie control on Panel3.
- In the Properties window, set the following properties of .
| Property |
Value |
| DataSource |
c1NwindDataSetBindingSource |
| Dock |
Fill |
| DataMember |
Category Sales for 2014 |
| Binding |
CategorySales |
| BindingName |
Expr1 |
- Drag and drop FlexChart control on the DashboardLayout.
Observe: A child container named Panel5 is created under it. As the WrapContents property of the FlowContentPanel is set to true and width of the C1DashboardLayout is exhausted, the child container containing FlexChart wraps to the next row. Otherwise, the child container will get clipped.
- Select Panel5 and set the following properties.
| Property |
Value |
| Size |
560,330 |
| Caption on c1DashboardLayout1 |
Ten Most Expensive Products |
- Select FlexChart and set the following properties.
| Property |
Value |
| DataSource |
c1NwindDataSetBindingSource |
| Dock |
Fill |
| DataMember |
Ten Most Expensive Products |
| Binding |
UnitPrice |
| BindingX |
TenMostExpensiveProducts |
- Select C1DasboardLayout and in the Properties window, navigate to C1DashboardLayout > Styles > Common > BackColor property and set it to LightSteelBlue.
Note: If the BackColor property of C1DashboardLayout is set before adding child containers to it, the child containers inherit back color of the parent container. Therefore, changing the back color of C1DashboardLayout after adding child containers does not affect the child containers back color.
- Add the following code in Form1_Load event to populate the controls with data.
| C# |
Copy Code
|
private void Form1_Load(object sender, EventArgs e)
{
    C1NWindDataSetTableAdapters.Sales_by_CategoryTableAdapter salesByCategoryAdapter =
        new C1NWindDataSetTableAdapters.Sales_by_CategoryTableAdapter();
    salesByCategoryAdapter.Fill(c1NWindDataSet.Sales_by_Category);

    C1NWindDataSetTableAdapters.Category_Sales_for_2014TableAdapter categorySalesAdapter =
        new C1NWindDataSetTableAdapters.Category_Sales_for_2014TableAdapter();
    categorySalesAdapter.Fill(c1NWindDataSet.Category_Sales_for_2014);

    C1NWindDataSetTableAdapters.Ten_Most_Expensive_ProductsTableAdapter expensiveProductsAdapter =
        new C1NWindDataSetTableAdapters.Ten_Most_Expensive_ProductsTableAdapter();
    expensiveProductsAdapter.Fill(c1NWindDataSet.Ten_Most_Expensive_Products);
}
|
| VB |
Copy Code
|
Private  Sub Form1_Load(ByVal sender As Object, ByVal e As EventArgs)
    C1NWindDataSetTableAdapters.Sales_by_CategoryTableAdapter salesByCategoryAdapter =
        New C1NWindDataSetTableAdapters.Sales_by_CategoryTableAdapter()
    salesByCategoryAdapter.Fill(c1NWindDataSet.Sales_by_Category)

    C1NWindDataSetTableAdapters.Category_Sales_for_2014TableAdapter categorySalesAdapter =
        New C1NWindDataSetTableAdapters.Category_Sales_for_2014TableAdapter()
    categorySalesAdapter.Fill(c1NWindDataSet.Category_Sales_for_2014)

    C1NWindDataSetTableAdapters.Ten_Most_Expensive_ProductsTableAdapter expensiveProductsAdapter =
        New C1NWindDataSetTableAdapters.Ten_Most_Expensive_ProductsTableAdapter()
    expensiveProductsAdapter.Fill(c1NWindDataSet.Ten_Most_Expensive_Products)
End Sub
|
- Run the application. A simple dashboard with three child containers is displayed.
Back to Top