Financial Chart provides a Ribbon-based toolbar in addition to the already available toolbar. It has been designed to control chart' settings at runtime with the Office 365 based UI. The Chart Ribbon comes with a flat-style user interface with tabs, groups, items, menu etc. and it also lets you switch between full and simplified views. With this chart feature, you can categorize menu items into groups and tabs, and achieve a clean and organized look, similar to what Microsoft offers in its Office 365 applications.
In Financial Chart, the Ribbon control is represented by C1Ribbon class of the C1.Win.Ribbon assembly. All chart-based ribbon features of Financial Chart can be accessed using the C1.Win.Chart.Ribbon namespace.
To access Financial Chart Ribbon, right-click the Financial Chart control and select Add/Remove Ribbon option from the context menu.
By default, the Financial Chart Ribbon appears in a simplified view, wherein some elements are shown in a single row, while others can be accessed using the ellipsis button (![]() ) as shown in the following image.
) as shown in the following image.

You can expand the ribbon to see full view by clicking on the chevron button (![]() ). The following image shows full view of Financial Chart Ribbon.
). The following image shows full view of Financial Chart Ribbon.
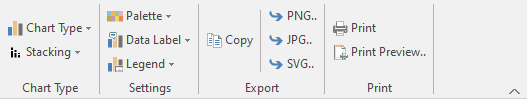
The following table provides a brief overview about the different options available in the Financial Chart Ribbon.
| Toolbar Commands | Description |
|---|---|
| Chart Type | Shows different chart type options. |
| Palette | Displays different color options to render the chart. |
| Legend | Provides different legend position options. |
| Data Label | Provides different data label position options. |
| Copy | Performs the copy operation. |
| Export | Provides different export options such as png, jpg, svg, etc. |
| Prints the chart. | |
| Print Preview | Opens the print preview dialog. |