FlexChart | ComponentOne
Chart Types / WinForms Area Charts
In This Topic
    WinForms Area Charts
    In This Topic

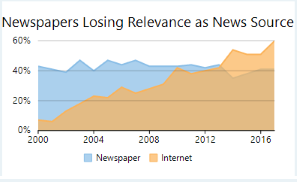
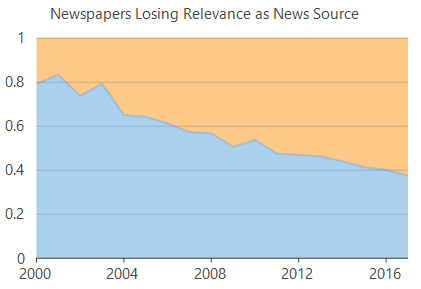
    Area charts are line charts with area between the line chart and axis filled with a color or shading. However, while line charts simply present the data values to demonstrate the trend, filled portion of the area chart helps in communicating the magnitude of the trend as well. These charts are also used to analyze a simple comparison between the trend of each category. For instance, an area chart can easily depict how internet is gradually taking over the newspaper as a source of getting news.

    Spline area charts and step area charts are other modifications of area charts where area between spline chart or step chart and axis is filled with a color or shading to indicate the magnitude of change. For more information on spline chart and step chart, see Line Charts.

    Area Chart

    Spline Area Chart

    Step Area Chart

    WinForms Area Chart WinForms Spline Area Chart WinForms Step Area Chart

    Create a WinForms Area Chart

    With FlexChart, you can create these charts by setting the ChartType property of FlexChart class as shown in the table below. This property accepts the values from ChartType enumeration of C1.Chart namespace.

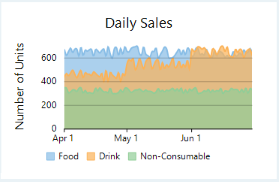
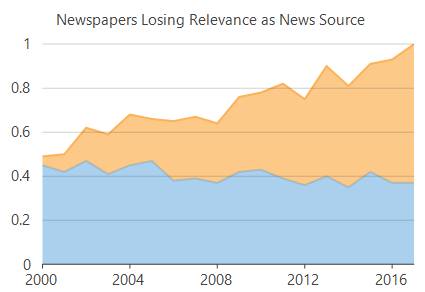
    FlexChart also provides options to stack the area charts. You can set the Stacking property of FlexChart class to Stacked or Stacked100pc for stacked or stacked100 area charts respectively. This property accepts the values from Stacking enumeration of C1.Chart namespace. Stacked charts are used for demonstrating the part-to-whole relationship that is, for displaying the cumulative values of categories. On the other hand, stacked 100 charts are used to present the percentage share of the values.

    Stacked Area Chart

    Stacked 100 Area Chart

    WinForms Stacked Area chart WinForms Stacked 100 Area Chart

    To create an area chart using FlexChart:

    At design-time

    1. Right click the FlexChart control on form to open the Properties window.
    2. Navigate to the ChartType property and set its value to "Area".
    3. Set the data source using the DataSource property.
    4. Configure X-axis and Y-axis values by setting the BindingX and Binding property respectively.

    Using code

    To create a WinForms area chart through code, the first step after initializing the control is to clear the default series and add a new series using the Add method. Set up the data source through the DataSource property and configure the X and Y axes by setting the BindingX and Binding property. You also need to set up the chart by setting the ChartType property and other required properties.

    this.flexChart1.Series.Clear();
    
    //Setting FlexChart ChartType to Area
    this.flexChart1.ChartType = ChartType.Area;
    
    //Setting FlexChart's Header 
    this.flexChart1.Header.Content = "Newspapers Losing Relevance as News Source";
    
    //Passing data in FlexChart
    this.flexChart1.DataSource = GetNewsSourcesInfo();
    
    //Binding FlexChart's AxisX to 'Year' so year appear in Horizontal axis
    this.flexChart1.BindingX = "Year";
    
    //Creating and adding two series in FlexChart, one for Newspaper field and other for Internet field
    this.flexChart1.Series.Add(new Series { Name = "Newspaper", Binding = "Newspaper" });
    this.flexChart1.Series.Add(new Series { Name = "Internet", Binding = "Internet" });
    
            ''' <summary>
            ''' Method for initializing FlexChart
            ''' </summary
            Protected Sub SetupChart()
    #Region "setupchart"
                Me.flexChart1.Series.Clear()
    
                'Setting FlexChart ChartType to Area
                Me.flexChart1.ChartType = ChartType.Area
    
                'Setting FlexChart's Header 
                Me.flexChart1.Header.Content = "Newspapers Losing Relevance as News Source"
    
                'Passing data in FlexChart
                Me.flexChart1.DataSource = GetNewsSourcesInfo()
    
                'Binding FlexChart's AxisX to 'Year' so year appear in Horizontal axis
                Me.flexChart1.BindingX = "Year"
    
                'Creating and adding two series in FlexChart, one for Newspaper field and other for Internet field
                Me.flexChart1.Series.Add(New Series() With {
                     .Name = "Newspaper",
                      .Binding = "Newspaper"
                })
                Me.flexChart1.Series.Add(New Series() With {
                      .Name = "Internet",
                      .Binding = "Internet"
                })
    

    Note that the above sample code uses a custom method named GetNewsSourcesInfo to supply data to the chart. You can set up the data source as per your requirements.

        /// <summary>
        /// Method for creating data for FlexChart
        /// </summary>
        Random rnd = new Random();
    public List<Object> GetNewsSourcesInfo()
    {
        var data = new List<Object>();
        for (int year = 2000; year <= 2017; year++)
        {
            var count = year - 1999;
            data.Add(new
            {
                Year = year,
                TV = rnd.Next(71 - count / 2, 71 + count / 2) / 100f,
                Newspaper = rnd.Next(40 - count / 3, 40 - count / 3 + 10) / 100f,
                Radio = rnd.Next(30 - count, 30 - count + 3) / 100f,
                Internet = rnd.Next(count * 3, count * 3 + 10) / 100f,
            });
        }
        return data;
    }
    
    ''' <summary>
    ''' Method for creating data for FlexChart
    ''' </summary>
    Private rnd As New Random()
    Public Function GetNewsSourcesInfo() As List(Of [Object])
        Dim data As List(Of [Object]) = New List(Of [Object])()
        For year As Integer = 2000 To 2017
            Dim count As Integer = year - 1999
            data.Add(New With {
                  .Year = year,
                  .TV = rnd.[Next](71 - count \ 2, 71 + count \ 2) / 100.0F,
                  .Newspaper = rnd.[Next](40 - count \ 3, 40 - count \ 3 + 10) / 100.0F,
                  .Radio = rnd.[Next](30 - count, 30 - count + 3) / 100.0F,
                  .Internet = rnd.[Next](count * 3, count * 3 + 10) / 100.0F
            })
        Next
        Return data
    End Function