FlexChart | ComponentOne
Chart Types / WinForms Bar and Column Charts
In This Topic
    WinForms Bar and Column Charts
    In This Topic

    WinForms Bar Chart

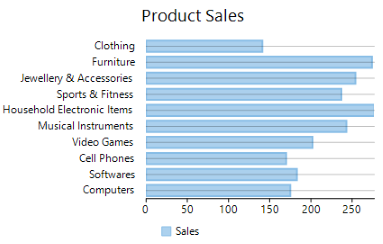
    Bar charts compare categorical data through the horizontal bars, where length of each bar represents the value of the corresponding category. Y-axis in these charts is a category axis. For example, sales of various product categories can be well presented through a bar chart.

    WinForms Column Chart

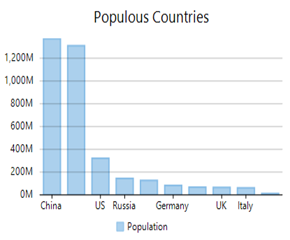
    Column charts are simply vertical version of bar charts and they use X- axis as a category axis. Though bar charts and column charts can be used interchangeably, column charts are preferred where number of values is too large to be accommodated on an X-axis while bar charts are preferred in the case of long category titles which are difficult to fit on an X-axis or in the case of large number of categories. For example, population share of different countries across the globe is good example that can be demonstrated using a column chart.

    Bar Chart

    Column Chart

    WinForms Bar Chart WinForms Column Chart

    Create a WinForms Bar or Column Chart

    With FlexChart, you can create a bar chart and a column chart by setting the ChartType property of FlexChart class to Bar or Column. This property accepts the values from ChartType enumeration of C1.Chart namespace.

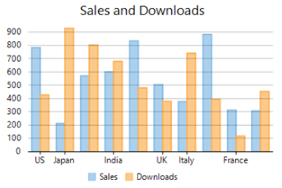
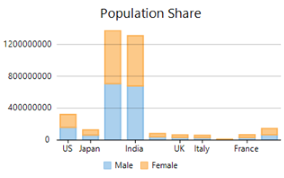
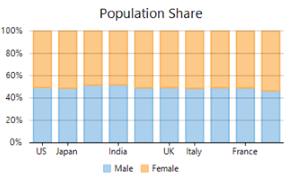
    FlexChart also provides options to cluster and stack the bar and column charts. While cluster is simply created by adding the multiple series with same base category to the chart, stacking can be done by setting the Stacking property of FlexChart class to Stacked or Stacked100pc. Stacked charts are used for demonstrating the part-to-whole relationship that is, for displaying the cumulative values of categories. For example, population of each gender in different countries can be presented by a stacked column chart. On the other hand, stacked 100 charts are used to present the percentage share of the values.

    Clustered Column Chart

    Stacked Column Chart

    Stacked 100 Column Chart

    WinForms Clustered Column Chart WinForms Column Stacked Chart WinForms Column Stacked 100 Chart

    To create a bar or column chart using FlexChart:

    At design-time

    1. Right click the FlexChart control on form to open the Properties window.
    2. Navigate to the ChartType property and set its value to "Bar" or "Column".
    3. Set the data source using the DataSource property.
    4. Configure X-axis and Y-axis values by setting the BindingX and Binding property respectively.

    Using code

    To create a WinForms bar chart through code, the first step after initializing the control is to clear the default series and add a new series using the Add method. Set up the data source through the DataSource property and configure the X and Y axes by setting the BindingX and Binding property. You also need to set up the chart by setting the ChartType property and other required properties.

    this.flexChart1.Series.Clear();
    
    //Setting FlexChart ChartType to Bar
    this.flexChart1.ChartType = ChartType.Bar;
    
    //Setting FlexChart's Header
    this.flexChart1.Header.Content = "Product Sales";
    
    //Passing data in FlexChart
    this.flexChart1.DataSource = GetData();
    
    //Binding FlexChart's AxisX to 'Beverages' so their Unit Price appear in Horizontal axis
    this.flexChart1.BindingX = "Beverages";
    
    //Creating and adding a series in FlexChart for Unit Price 
    var items = new Series
    {
        Name = "Unit Price",
        Binding = "Unit Price",
    };
    this.flexChart1.Series.Add(items);
    
            ''' <summary>
            ''' Method for initializing FlexChart
            ''' </summary
            Protected Sub SetupChart()
    #Region "setupchart"
                Me.flexChart1.Series.Clear()
    
                'Setting FlexChart ChartType to Bar
                Me.flexChart1.ChartType = ChartType.Bar
    
                'Setting FlexChart's Header
                Me.flexChart1.Header.Content = "Product Sales"
    
                'Passing data in FlexChart
                Me.flexChart1.DataSource = GetData()
    
                'Binding FlexChart's AxisX to 'Beverages' so their Unit Price appear in Horizontal axis
                Me.flexChart1.BindingX = "Beverages"
    
                'Creating and adding a series in FlexChart for Unit Price 
                Dim items As Series = New Series() With {
                     .Name = "Unit Price",
                     .Binding = "Unit Price"
                }
                Me.flexChart1.Series.Add(items)
    

    Note that the above sample code uses a custom method named GetData to supply data. You can set up the data source as per your requirements.

    public DataTable GetData()
    {
        // create a datatable
        DataTable dt = new DataTable("Product Comparison");
    
        // add columns to the datatable
        dt.Columns.Add("Beverages", typeof(string));
        dt.Columns.Add("Unit Price", typeof(int));
        dt.Columns.Add("Units In Stock", typeof(int));
        dt.Columns.Add("Units On Order", typeof(int));
    
        // add rows to the datatable
        dt.Rows.Add("Tea", 18, 39, 40);
        dt.Rows.Add("Coffee", 19, 17, 70);
        dt.Rows.Add("Cocktail", 10, 13, 30);
        dt.Rows.Add("Mock Tail", 22, 53, 20);
        dt.Rows.Add("Soft Drink", 21, 120, 70);
        dt.Rows.Add("Mineral Water", 25, 90, 40);
    
        return dt;
    }
    
    ''' <summary>
    ''' Method for creating data for FlexChart
    ''' </summary>
    
    Private sales As New List(Of SeasonSale)()
    Public Function GetData() As DataTable
        ' create a datatable
        Dim dt As New DataTable("Product Comparison")
    
        ' add columns to the datatable
        dt.Columns.Add("Beverages", GetType(String))
        dt.Columns.Add("Unit Price", GetType(Integer))
        dt.Columns.Add("Units In Stock", GetType(Integer))
        dt.Columns.Add("Units On Order", GetType(Integer))
    
        ' add rows to the datatable
        dt.Rows.Add("Tea", 18, 39, 40)
        dt.Rows.Add("Coffee", 19, 17, 70)
        dt.Rows.Add("Cocktail", 10, 13, 30)
        dt.Rows.Add("Mock Tail", 22, 53, 20)
        dt.Rows.Add("Soft Drink", 21, 120, 70)
        dt.Rows.Add("Mineral Water", 25, 90, 40)
    
        Return dt
    End Function