Chart Designer refers to a run-time designer that empowers the end-user to customize the chart by changing the chart properties while visualizing the same. Such designers come really handy in applications such as dashboard designers which require end-user to customize the chart at run-time as per requirement.
FlexChart Designer is a compact and responsive designer which appears on clicking the chart elements at run-time and provides a user interface to change various settings related to Chart, Data, Header, Footer, Legend, X-Axis, Y-Axis and Data Labels.
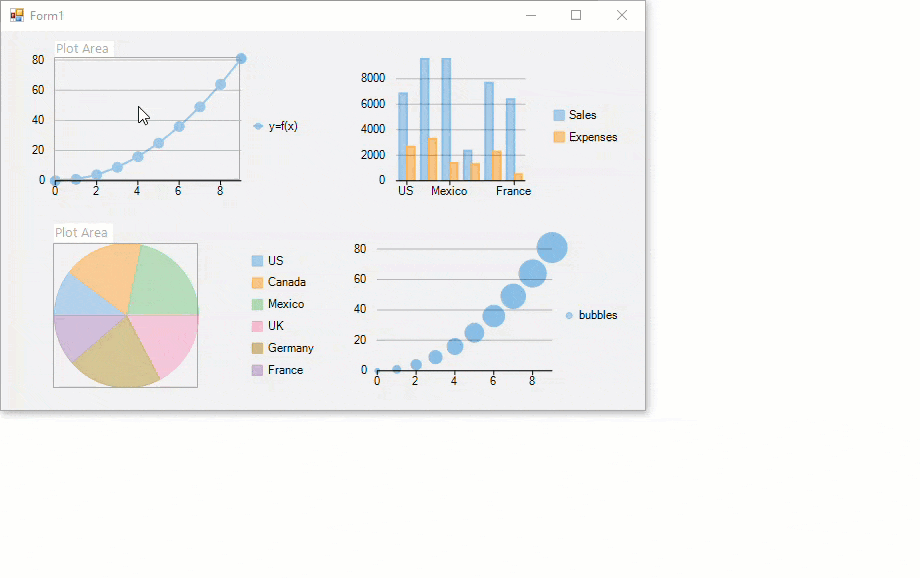
The chart elements such as plot area, x-axis, y-axis, legend, header and footer get highlighted as the user moves the mouse cursor over the chart. The ChartDesigner appears when any of these elements is clicked for the first time and displays the property list of the corresponding chart element. This property list in the designer keeps on changing depending on the element selected in the chart area. You can also select the desired chart element from the drop-down menu available on the top-left corner of the designer. The table below describes each of these options provided by the FlexChart Designer drop-down menu.
| Drop-down Options | Descriptions |
| Chart | Displays the properties related to appearance of the chart such as BackColor, ForeColor, PlotColor, Font and Stacking. It also provides the ChartType property that lets you change the chart type to any of the basic charts at run-time. This property is not displayed in the case of charts such as pie chart, treemap or sunburst chart. |
| Data | Displays all the data fields of the chart. It lets you bind the data simply by dragging and dropping data fields on to X-axis and Y-axis sections on the right-hand-side of the window. You can easily create multiple series or multiple pie charts by using this option. |
| Header | Lets you customize the chart header. Using this option, you can add, remove, edit or style the header content through properties such as Content, Color, Font, Border, BorderFill etc. |
| Footer | Lets you customize the chart footer. Using this option, you can add, remove, edit or style the footer content through properties such as Content, Color, Font, Border, BorderFill etc. |
| Legend | Allows you to specify the legend related settings of the chart. You can choose to hide, display or style the chart legend by using the properties such as Title, Position, ForeColor, Font etc. |
| X-Axis | Displays the properties related to the X-Axis of chart like Title, Labels, LabelAngle, Min, Max, MajorTicks etc. This option does not appear in the drop-down menu list in the case of charts such as pie chart, treemap or a sunburst chart. |
| Y-Axis | Displays the properties related to the Y-Axis of chart like Title, Labels, LabelAngle, Min, Max, MajorTicks etc. This option does not appear in the drop-down menu list in the case of charts such as pie chart, treemap or a sunburst chart. |
| Data Label | Lets you display, hide, position or style the data point values on charts. Some of the data label related properties provided by the designer are Content, Color, Font, Connecting Line, Position etc. |
In FlexChart, the FlexChart Designer is represented by the ChartDesigner class provided by C1.Win.Chart.Designer namespace of the C1.Win.FlexChart.Designer assembly. You can easily invoke the designer for a particular FlexChart by creating an instance of the ChartDesigner class and passing the FlexChart control as a parameter to this ChartDesigner constructor.