FlexChart | ComponentOne
Elements / Series
In This Topic
    Series
    In This Topic

    Series is a set of related data points that are plotted on a chart. By default, FlexChart displays a column chart with dummy data series at design-time as shown in the following image.

    Series added with dummy data

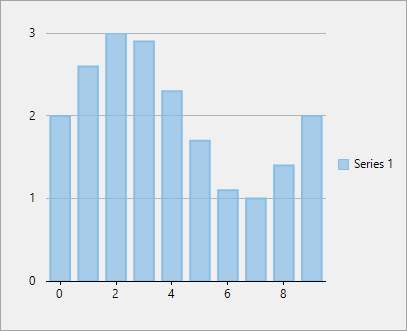
    However, you need to provide the control with data to render the chart at runtime.

    In FlexChart, a series is represented by the Series class. Although, axis and chart type related properties are generally set on the whole chart, FlexChart also provides you AxisX, AxisY, ChartType, DataSource etc. for each series as well. This is helpful in scenarios such as rendering mixed charts, multiple axes etc. The Series class also provides the Name property whose text value represents that chart series in the legend. In case of line chart and area chart, you can also handle the null values in data to avoid gaps in plotting the chart series by setting the InterpolateNulls property to true.

    Add a Series

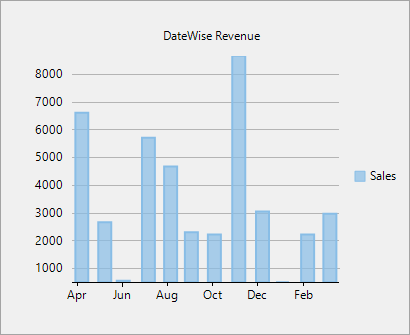
    FlexChart lets you add a series at design-time as well as through code. Follow the steps below to add a series as illustrated in the image below:

    Series added

    1. Open Properties window to view FlexChart properties.
    2. Navigate to the Series field and click the Ellipsis button next to it.
      Series Collection Editor appears with a pre-added series, Series 1.
    3. Click the Add button to add an additional series.

    OR

    You can also add a series through Add Series Tasks smart tag panel as illustrated in Design-time support topic.

    To add a series through code, first create a series by creating an instance of the Series class and then, add it to the FlexChart series collection by using the Add method. FlexChart series collection can be accessed through the FlexChart.Series property.

    C#
    Copy Code
    //Adding a Series to chart and binding it (AxisY) to 'Revenue' field of DataCollection   
    this.flexChart1.Series.Add(new C1.Win.Chart.Series
    {
    //Name property specifies the string to be displayed corresponding to this Series in Legend
    Name = "Sales",
    Binding = "Revenue"
    });
    
    VB
    Copy Code
                                                   
       'Adding a Series to chart and binding it (AxisY) to 'Revenue' field of DataCollection   
        Me.flexChart1.Series.Add(New C1.Win.Chart.Series() With {
          'Name property specifies the string to be displayed corresponding to this Series in Legend
          .Name = "Sales",
          .Binding = "Revenue"
       })


    Add Data to Series

    FlexChart provides multiple ways to add data to a chart series. You can opt for fetching all the data to plot a chart from a single data source or, bind a particular series or axis individually with separate data sources. For more information on binding and adding data to a chart series, see Binding.

    Change the Visibility of Series

    FlexChart provides flexibility to hide or display a series on plot area, legend, or both through the Visibility property. The value for this property is set through SeriesVisibility enumeration. The SeriesVisibility enumeration provides the following options: 

    Values Description
    Visible The series is visible both on the plot and in the legend.
    Legend The series is visible only in the legend.
    Plot The series is visible only on the plot.
    Hidden The series is hidden.

    The following line of code is written inside the Series.Add method to restrict the visibility of the series only to the plot as illustrated in the image below:

    Series with only plot visibility

       //Set the visibility of the series only to plot
       Visibility = C1.Chart.SeriesVisibility.Plot
    
       'Set the visibility of the series only to plot  
       Visibility = C1.Chart.SeriesVisibility.Plot
    

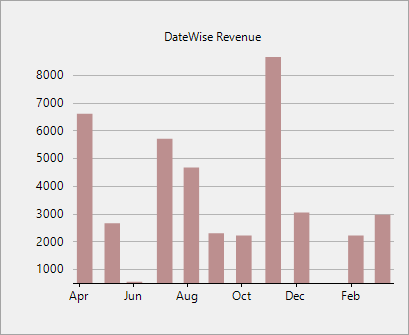
    Further, FlexChart also provides LegendToggle property that allows the end user to toggle the visibility of series by clicking on the corresponding legend entry as shown in the image below.

    series toggle

      // Displays or hides a series by clicking on corresponding legend entry
       this.flexChart1.LegendToggle = true;                        
    
      'Displays or hides a series by clicking on corresponding legend entry
       Me.flexChart1.LegendToggle = True
    

    Style a Series

    FlexChart provides the Style property of Series class to change the appearance of a series. For symbol charts such as scatter, line symbol etc., you can also change the markers, their size and style by setting the SymbolMarker, SymbolSize, SymbolStyle properties. Moreover, chart also provides built-in chart palettes so that you can easily customize the look of your chart by just setting the Palette property. For more information on palettes, see Appearance and Styling.

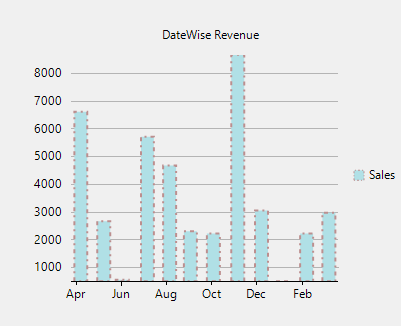
    The following line of code changes the fill color, line pattern and stroke color of the columns of the chart as shown in the below image

    Series style

       // Style the series
            this.flexChart1.Series[0].Style.FillColor = Color.PowderBlue;
            this.flexChart1.Series[0].Style.StrokeColor = Color.RosyBrown;
            this.flexChart1.Series[0].Style.LinePattern = C1.Chart.LinePatternEnum.DashDot;      
    
       ' Style the series
            Me.flexChart1.Series(0).Style.FillColor = Color.PowderBlue
            Me.flexChart1.Series(0).Style.StrokeColor = Color.RosyBrown
            Me.flexChart1.Series(0).Style.LinePattern = C1.Chart.LinePatternEnum.DashDot
    
    See Also