FlexChart | ComponentOne
Chart Types / Statistical Charts / WinForms Waterfall Chart
In This Topic
    WinForms Waterfall Chart
    In This Topic

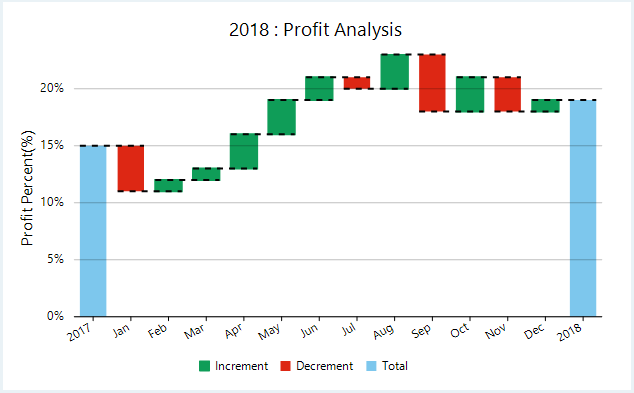
    Waterfall charts are the statistical charts that demonstrate the cumulative effect of increasing and decreasing intermediate values on an initial value to result in a final value. These charts generally represent the initial and final values as blue colored total columns and intermediate values as green and red floating columns for increments and decrements respectively. These charts are helpful in scenarios such as viewing fluctuations in product earnings or for profit analysis as shown in the chart below.

    WinForms Waterfall chart

    Create a WinForms Waterfall Chart

    In FlexChart, a WinForms waterfall chart can be implemented using the Waterfall class which represents a waterfall series. Apart from other series related properties, this class provides properties specific to waterfall series such as the ShowTotal or ShowIntermediateTotal properties, which let you specify whether to display the total and intermediate total columns or not. You can also choose whether to display the ConnectorLines. FlexChart also allows you to change the style of these columns by setting the RisingStyle, FallingStyle, TotalStyle, and StartStyle properties respectively.

    // clear data series collection
    flexChart1.Series.Clear();
    
    // bind FlexChart's X-axis
    flexChart1.BindingX = "Month";
    
    // create a Waterfall series
    _waterfall = new C1.Win.Chart.Waterfall() { Binding = "PChange", Name = "Increment,Decrement,Total" };
    _waterfall.IntermediateTotalLabels = new string[] { "Q1", "Q2", "Q3", "Q4" };
    _waterfall.IntermediateTotalPositions = new int[] { 3, 6, 9, 12 };
    _waterfall.Start = 0.15;
    _waterfall.StartLabel = (DateTime.Now.Year - 2).ToString(); _waterfall.TotalLabel = (DateTime.Now.Year - 1).ToString();
    
    // add the Waterfall series to the FlexChart series collection
    flexChart1.Series.Add(_waterfall);
    
    // specify the datasource for the FlexChart
    flexChart1.DataSource = GetProfitStatement();
    
    // specify titles for FlexChart header 
    flexChart1.Header.Content = string.Format("{0} : Profit Analysis", DateTime.Now.Year - 1);
    
    // specify AxisY Header and format
    flexChart1.AxisY.Title = "Profit Percent(%)";
    flexChart1.AxisY.Format = "p0";
    
            ''' <summary>
            ''' Method for initializing StatisticalChart
            ''' </summary
            Private Sub SetupChart()
    #Region "SetupChart"
                ' clear data series collection
                flexChart1.Series.Clear()
    
                ' bind FlexChart's X-axis
                flexChart1.BindingX = "Month"
    
                ' create a Waterfall series
                _waterfall = New C1.Win.Chart.Waterfall() With {
                     .Binding = "PChange",
                     .Name = "Increment,Decrement,Total"
                }
                _waterfall.IntermediateTotalLabels = New String() {"Q1", "Q2", "Q3", "Q4"}
                _waterfall.IntermediateTotalPositions = New Integer() {3, 6, 9, 12}
                _waterfall.Start = 0.15
                _waterfall.StartLabel = (DateTime.Now.Year - 2).ToString()
                _waterfall.TotalLabel = (DateTime.Now.Year - 1).ToString()
    
                ' add the Waterfall series to the FlexChart series collection
                flexChart1.Series.Add(_waterfall)
    
                ' specify the datasource for the FlexChart
                flexChart1.DataSource = GetProfitStatement()
    
                ' specify titles for FlexChart header 
                flexChart1.Header.Content = String.Format("{0} : Profit Analysis", DateTime.Now.Year - 1)
    
                ' specify AxisY Header and format
                flexChart1.AxisY.Title = "Profit Percent(%)"
                flexChart1.AxisY.Format = "p0"
    

    Note that the above sample code uses a custom method named GetProfitStatement to supply data to the chart. You can set up the data source as per your requirements.

        /// <summary>
        /// Method for creating data for StatisticalChart
        /// </summary>
    private Random rnd = new Random();
    private DataSource _dataHelper = new DataSource().Instance;
    public List<Object> GetProfitStatement()
    {
        var data = new List<Object>();
        var change = 0.10f;
        for (int i = 0; i < 12; i++)
        {
            change += change >= 0.20f ? -rnd.Next(1, 10) / 100f : rnd.Next(1, 4) / 100f;
            data.Add(new
            {
                Month = _dataHelper.Months[i],
                Change = rnd.Next(1000, 10000) > 5000 ? rnd.Next(1000, 10000) : -rnd.Next(1000, 5000),
                PChange = change,
            });
        }
        return data;
    }
    
    ''' <summary>
    ''' Method for creating data for StatisticalChart
    ''' </summary>
    Private rnd As New Random()
    Private _dataHelper As DataSource = New DataSource().Instance
    Public Function GetProfitStatement() As List(Of [Object])
        Dim data As List(Of Object) = New List(Of [Object])()
        Dim change As Double = 0.1F
        For i As Integer = 0 To 11
            change += If(change >= 0.2F, -rnd.[Next](1, 10) / 100F, rnd.[Next](1, 4) / 100F)
            data.Add(New With {
                 .Month = _dataHelper.Months(i),
                 .Change = If(rnd.[Next](1000, 10000) > 5000, rnd.[Next](1000, 10000), -rnd.[Next](1000, 5000)),
                 .PChange = change
            })
        Next
        Return data
    End Function
    
    See Also