FlexChart lets you to create and apply colored regions called chart zones. The colored zones categorize the plotted data on the chart into regions, which makes it easier for the user to read and understand the data. This helps the users to easily identify the category in which a particular data point lies.
To explain how creating zones can be helpful, consider a customer satisfaction survey that aims at identifying whether a customer is a promoter, a passive customer, or a detractor for a specific product. The responses recorded in the survey can be used to calculate NPS (Net Promoter Score) that classifies customers into promoters, passives, and detractors. This scenario can be realized in FlexChart by plotting customer responses as data points in chart and categorizing them in colored zones using area chart as showcased in the following image:
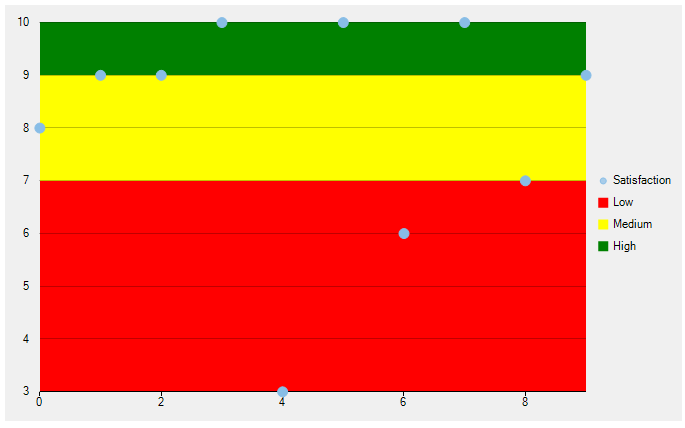
In FlexChart, zones can be created as data series available through the Series class. Each zone can be created as area charts by setting the ChartType property to Area, highlighted in distinct colors. To distinguish each zone, line type data series can be created as thresholds in the chart.
Complete the following steps to create zones in FlexChart.
| C# |
Copy Code
|
|---|---|
/// Class for FlexChart's DataSource /// </summary> public class SurveyResult { public int surveyNumber { get; set; } public int satisfaction { get; set; } public SurveyResult(int surveyNumber, int satisfaction) { this.surveyNumber = surveyNumber; this.satisfaction = satisfaction; } } |
|
| C# |
Copy Code
|
|---|---|
public class Zone { public string Name { get; set; } public double Value { get; set; } public Color Fill { get; set; } } |
|
| C# |
Copy Code
|
|---|---|
results = new ObservableCollection<SurveyResult>(); zones = new ObservableCollection<Zone>(); |
|
| C# |
Copy Code
|
|---|---|
//Add DataSource to the FlexChart int[] scores = { 8, 9, 9, 10, 3, 10, 6, 10, 7, 9 }; for (int i = 0; i < 10; i++) { results.Add(new SurveyResult(i, scores[i])); } this.flexChart1 = new FlexChart(); this.flexChart1.DataSource = results; this.flexChart1.BindingX = "surveyNumber"; this.flexChart1.ChartType = ChartType.Scatter; |
|
| C# |
Copy Code
|
|---|---|
//Add series in FlexChart var satisfactionSeries = new Series(); satisfactionSeries.Name = "Satisfaction"; satisfactionSeries.Binding = "satisfaction"; flexChart1.Series.Add(satisfactionSeries); |
|
| C# |
Copy Code
|
|---|---|
//Add zones to legend for (int i = 0; i < zones.Count; i++) { var series = new Series(); series.ChartType = ChartType.Area; series.Style.Fill = new SolidBrush(zones[i].Fill); series.Style.Stroke = new SolidBrush(Color.Transparent); series.Name = zones[i].Name; this.flexChart1.Series.Add(series); } this.flexChart1.Legend.Position = Position.Right; |
|
| C# |
Copy Code
|
|---|---|
private void FlexChart1_Rendering(object sender, RenderEventArgs e) { var chart = sender as FlexChart; for (int i = 0; i < zones.Count; i++) { //Get Min/Max range from FlexChart var minY = i == 0 ? flexChart1.AxisY.ActualMin : zones[i - 1].Value; var maxY = i == zones.Count-1 ? flexChart1.AxisY.ActualMax : zones[i].Value; var minX = flexChart1.AxisX.ActualMin; var maxX = flexChart1.AxisX.ActualMax; var pt1 = chart.DataToPoint(new PointF((float)minX, (float)minY)); var pt2 = chart.DataToPoint(new PointF((float)maxX, (float)maxY)); //Draw Zone Rectangle. e.Engine.SetFill(new SolidBrush(zones[i].Fill)); e.Engine.SetStroke(new SolidBrush(Color.Transparent)); e.Engine.DrawRect(pt1.X, pt2.Y, Math.Abs(pt2.X - pt1.X), Math.Abs(pt2.Y - pt1.Y)); } } |
|