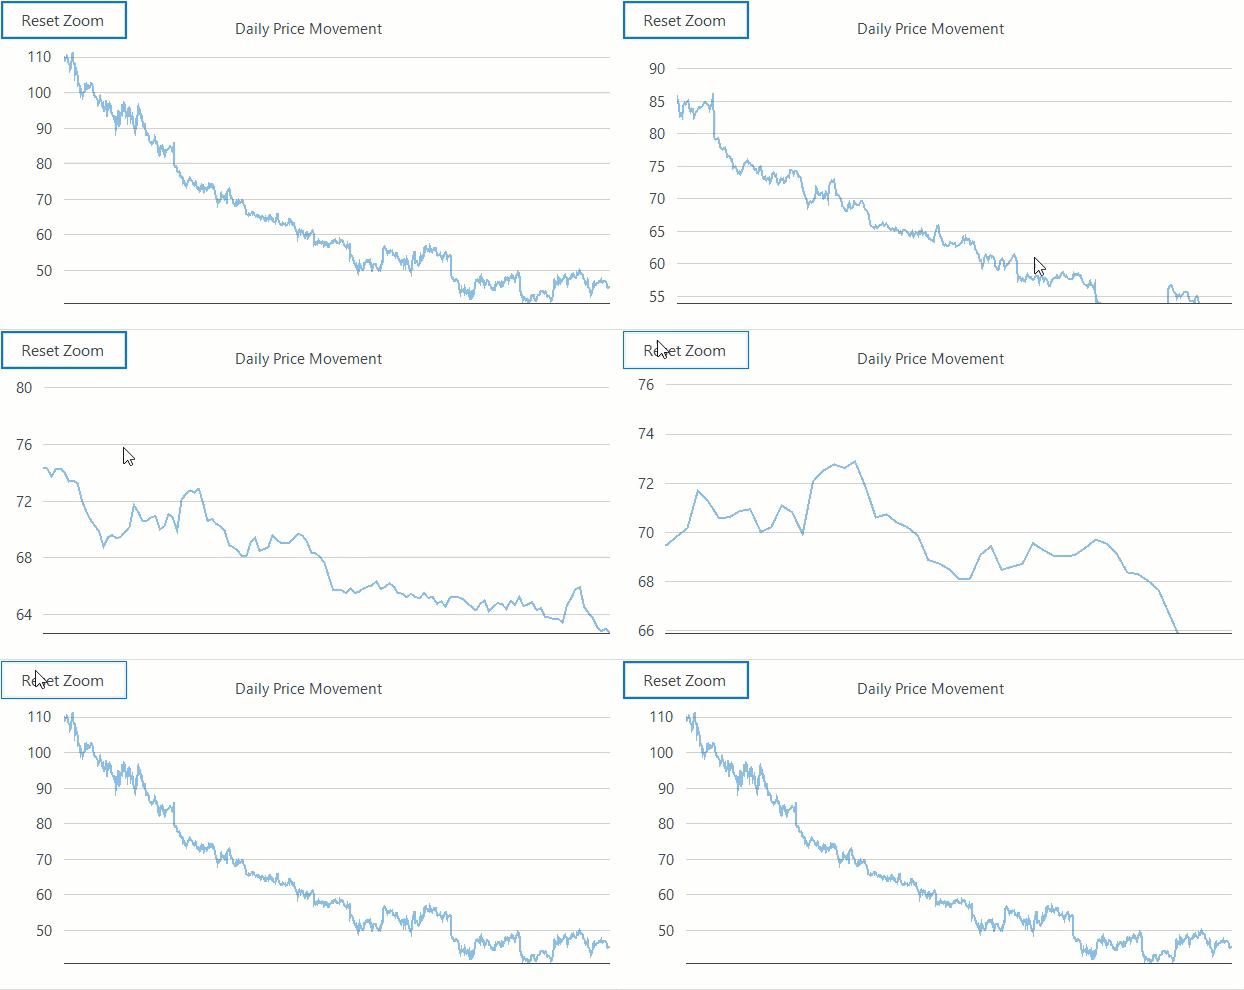
private void FlexChart1_Rendered(object sender, RenderEventArgs e)
{
    if (!_start.IsEmpty && !_last.IsEmpty)
    {
        // draw selection
        var p1 = _start;
        var p2 = _last;
        e.Engine.SetFill(null);
        e.Engine.SetStroke(Brushes.Red);
        e.Engine.SetStrokeThickness(1);
        e.Engine.SetStrokePattern(new double[] { 3, 3 });
        e.Engine.DrawRect(Math.Min(p1.X, p2.X), Math.Min(p1.Y, p2.Y), Math.Abs(p2.X - p1.X), Math.Abs(p2.Y - p1.Y));
    }
}

private void FlexChart1_MouseDown(object sender, MouseEventArgs e)
{
    //Start Zooming
    _IsMouseDown = true;
    _start = e.Location;
    _last = Point.Empty;
}

private void FlexChart1_MouseMove(object sender, MouseEventArgs e)
{
    //Drawing zoom region rectangle borders and update selection range
    if (_IsMouseDown)
    {
        var ptCurrent = e.Location;
        var left = (int)flexChart1.PlotRect.Left;
        var right = (int)flexChart1.PlotRect.Right;
        var top = (int)flexChart1.PlotRect.Top;
        var bot = (int)flexChart1.PlotRect.Bottom;

        //Making sure that rectangle's end coordinate lies within FlexChart's PlotRect
        ptCurrent.X = ptCurrent.X < left ? left : ptCurrent.X > right ? right : ptCurrent.X;
        ptCurrent.Y = ptCurrent.Y < top ? top : ptCurrent.Y > bot ? bot : ptCurrent.Y;
        _last = ptCurrent;
        flexChart1.Refresh();
    }
}
private void FlexChart1_MouseUp(object sender, MouseEventArgs e)
{
    // Stop Zooming
    _IsMouseDown = false;
    if (!_last.IsEmpty)
    {
        var start = flexChart1.PointToData(_start);
        var last = flexChart1.PointToData(_last);
        //Update axes with new limits
        flexChart1.AxisX.Min = Math.Min(start.X, last.X);
        flexChart1.AxisX.Max = Math.Max(start.X, last.X);
        flexChart1.AxisY.Min = Math.Min(start.Y, last.Y);
        flexChart1.AxisY.Max = Math.Max(start.Y, last.Y);
    }
    // Clean up
    _start = _last = Point.Empty;
}
Private Sub FlexChart1_Rendered(sender As Object, e As RenderEventArgs)
    If Not _start.IsEmpty AndAlso Not _last.IsEmpty Then
        ' draw selection
        Dim p1 As Point = _start
        Dim p2 As Point = _last
        e.Engine.SetFill(Nothing)
        e.Engine.SetStroke(Brushes.Red)
        e.Engine.SetStrokeThickness(1)
        e.Engine.SetStrokePattern(New Double() {3, 3})
        e.Engine.DrawRect(Math.Min(p1.X, p2.X), Math.Min(p1.Y, p2.Y), Math.Abs(p2.X - p1.X), Math.Abs(p2.Y - p1.Y))
    End If
End Sub

Private Sub FlexChart1_MouseDown(sender As Object, e As MouseEventArgs)
    'Start Zooming
    _IsMouseDown = True
    _start = e.Location
    _last = Point.Empty
End Sub

Private Sub FlexChart1_MouseMove(sender As Object, e As MouseEventArgs)
    'Drawing zoom region rectangle borders and update selection range
    If _IsMouseDown Then
        Dim ptCurrent As Point = e.Location
        Dim left As Integer = CInt(Math.Truncate(flexChart1.PlotRect.Left))
        Dim right As Integer = CInt(Math.Truncate(flexChart1.PlotRect.Right))
        Dim top As Integer = CInt(Math.Truncate(flexChart1.PlotRect.Top))
        Dim bot As Integer = CInt(Math.Truncate(flexChart1.PlotRect.Bottom))

        'Making sure that rectangle's end coordinate lies within FlexChart's PlotRect
        ptCurrent.X = If(ptCurrent.X < left, left, If(ptCurrent.X > right, right, ptCurrent.X))
        ptCurrent.Y = If(ptCurrent.Y < top, top, If(ptCurrent.Y > bot, bot, ptCurrent.Y))
        _last = ptCurrent
        flexChart1.Refresh()
    End If
End Sub

Private Sub FlexChart1_MouseUp(sender As Object, e As MouseEventArgs)
    ' Stop Zooming
    _IsMouseDown = False
    If Not _last.IsEmpty Then
        Dim start As PointF = flexChart1.PointToData(_start)
        Dim last As PointF = flexChart1.PointToData(_last)
        'Update axes with new limits
        flexChart1.AxisX.Min = Math.Min(start.X, last.X)
        flexChart1.AxisX.Max = Math.Max(start.X, last.X)
        flexChart1.AxisY.Min = Math.Min(start.Y, last.Y)
        flexChart1.AxisY.Max = Math.Max(start.Y, last.Y)
    End If
    ' Clean up
    _start = InlineAssignHelper(_last, Point.Empty)
End Sub
