Sparklines are the miniature charts visually representing a series of values to show trends such as periodic fluctuations, or to highlight maximum or minimum values of the data series. In grids, sparklines are specially useful as they easily fit in a single cell and can help identify the data patterns at a glance.
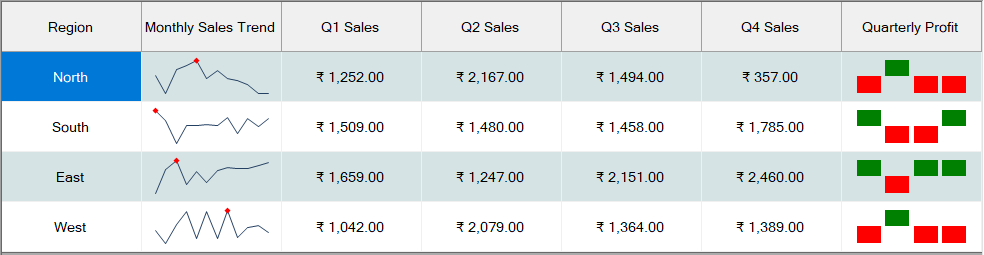
FlexGrid for WinForms lets you display sparklines in columns by setting ShowSparkline property of the Column class to true. You can also set the type of sparkline using SparklineType property of the Sparkline class. FlexGrid supports three types of sparklines which are:
To display the data markers on sparkline, you can set the ShowMarkers property to true. The Sparkline class also provides properties to highlight the first, last, highest, lowest or negative data points by displaying them in different format. You can even style the sparklines using the Styles property.
Below code shows how to add sparkline to the WinForms FlexGrid columns.