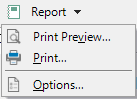
The Report Menu provides you with options to preview or print the report, setup report pages, add header and/or footers, and specify items to be shown in the report. On clicking the Report button available in the tool-strip, a context menu appears with Print Preview, Print and Options as follows.
The following table illustrates the options available in the Report context menu.
|
Print Preview |
Select Print Preview to preview your report before printing or to export to a PDF file. |
|
|
Click Print to print the C1FlexPivotGrid, FlexPivotChart, or both. |
|
Options |
Click Options to open the Document Options dialog box. |
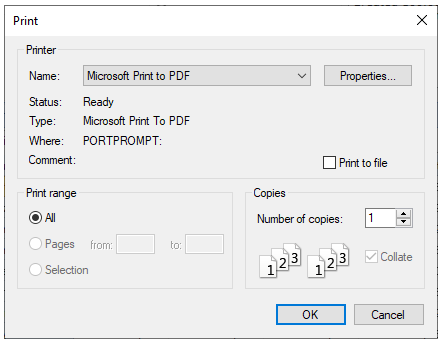
The Print option in Report menu, which when clicked opens the Print dialog. It lets you print the report data using different options including Microsoft Print to PDF.
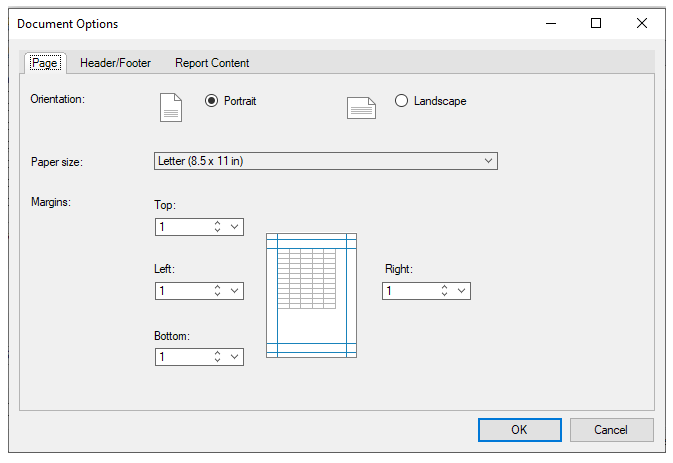
Page Tab
The page tab allows you to specify the Orientation, Paper Size, and Margins. See the image below to visualize the option more clearly.
Header/Footer Tab
The header/footer tab allows you to add a header and/or footer to each page of the report. See the image below to visualize the option more clearly.
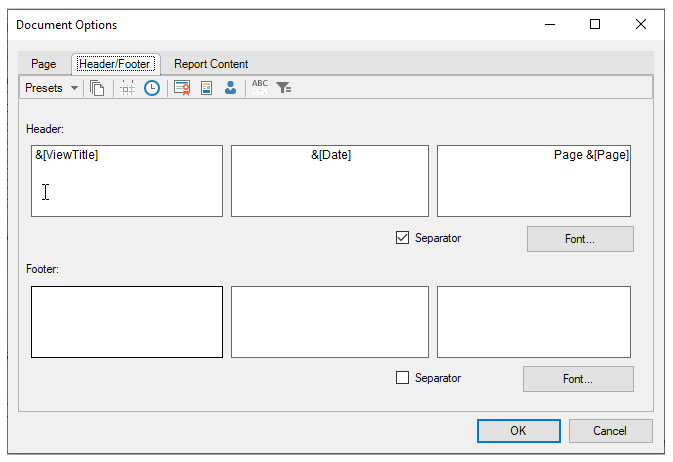
Click one of the buttons on the toolbar to insert fields into the header or footer.
|
Button |
Field |
|
Presets |
Choose from the three predefined options containing groups of fields to be inserted in the header or footer. |
|
Page Number |
&[Page] |
|
Current Date |
&[Date] |
|
Current Time |
&[Time] |
|
Document Name |
$[DocName] |
|
View Description |
&[ViewTitle] |
|
Author Name |
&[UserName] |
Check the Separator box to show a separator line below the header or above the footer. Click the Font button to change the font, style, size, or effects.
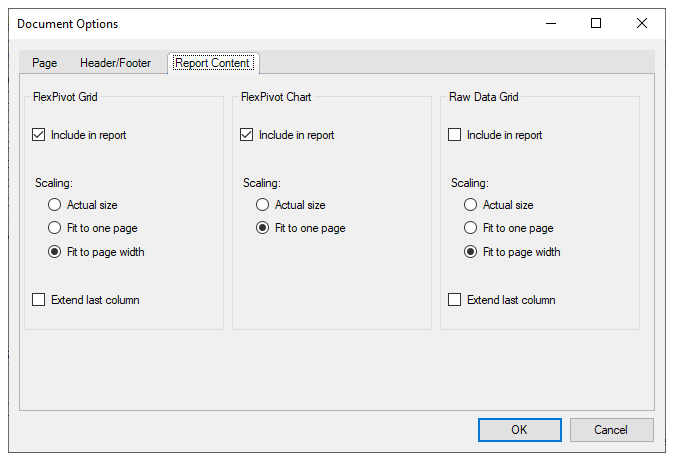
Report Content Tab
On the Report Content tab, you can determine whether to include the grid, chart, and/or raw data grid in your report. You can also scale the items as desired and extend the last columns of the grids.