ComponentOne FlexPivot for WinForms
Quick Start: FlexPivot for WinForms / Using FlexPivot Controls with C1DataEngine / Step 3: Creating Different Views at Runtime
In This Topic
    Step 3: Creating Different Views at Runtime
    In This Topic

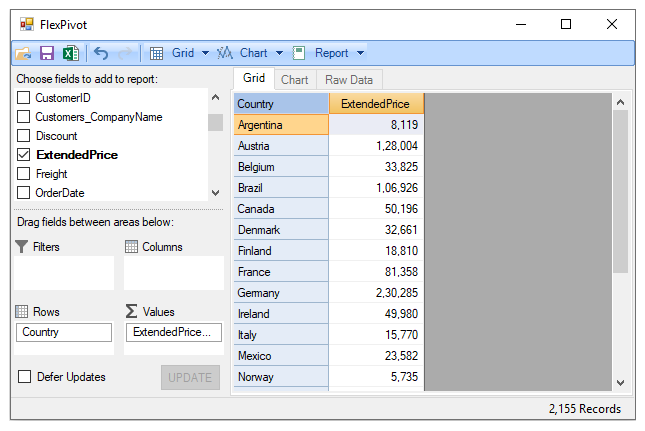
    Let us now take a look at how we can create different views of the data added using the DataEngine in the previous step.

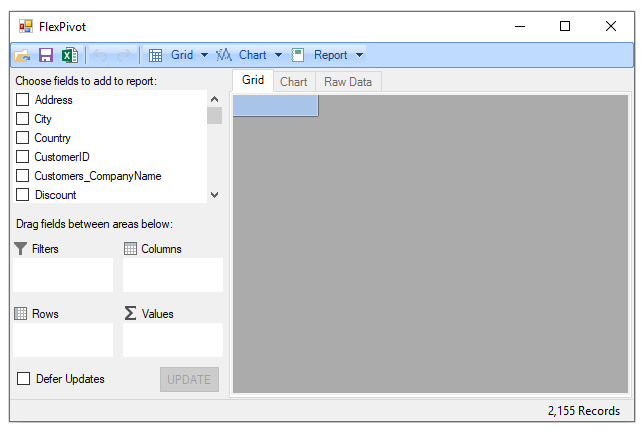
    Press F5 to run the application. FlexPivotPage is now connected to C1DataEngine and you can see the control appears similar to the image below with various data fields that you can choose for data analysis.

    FlexPivot_view
    You can create different views by dragging the data fields available in the FlexPivotPanel to Rows, Columns and Values lists as illustrated in the steps below.
    1. Drag the Country field from the FlexPivotPanel to Rows list, and Extended Price field to Values list. A summarized view of Extended Price against Countries appears in the form of a grid as shown in the image below.

      Pivotgrid_view

    2. Click the Chart tab to view the same data in chart format.

      FlexPivot_chart view

    3. Drag Salesperson field in the Columns list to slightly enhance the view. The new view shows Extended Price by Country and Salesperson.

      FlexPivotchart-multiplefields

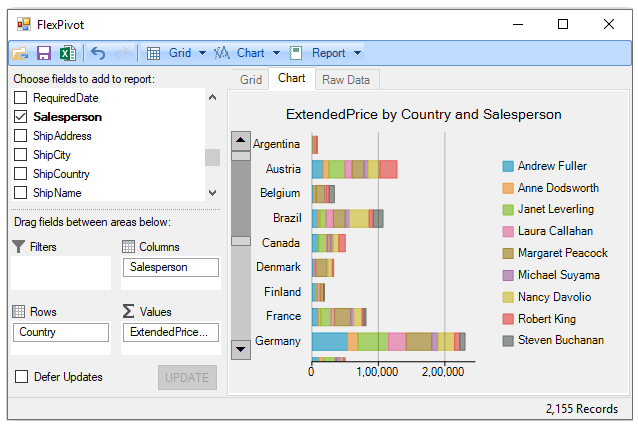
    With this, you have completed all the steps of this Quick Start guide.

    See Also