FlexReport supports map fields using its extensible custom field architecture. In the following sections, you'll see how you to customize map fields in reports using the FlexReportDesigner application. The Map custom field uses three assemblies, C1.Win.FlexReport.CustomFields, C1.Win and C1.Win.Map, which should be in the same folder as the FlexReportDesigner app.
To start using the Map custom field in the FlexReportDesigner application, complete the following steps:
|
Copy Code
|
|
|---|---|
<customfields>
    <item value="C1.Win.FlexReport.CustomFields.6;C1.Win.FlexReport.CustomFields.Map" />
</customfields>
|
|
|
Copy Code
|
|
|---|---|
<customfields>
    <item value="C1.Win.FlexReport.CustomFields.4.8;C1.Win.FlexReport.CustomFields.Map" />
</customfields>
|
|
|
Copy Code
|
|
|---|---|
<customfields>
    <item value="C1.Win.FlexReport.CustomFields.4.5.2;C1.Win.FlexReport.CustomFields.Map" />
</customfields>
|
|
You can find the C1FlexReportDesigner.4.5.2.exe.settings, C1FlexReportDesigner.4.8.exe.settings and C1FlexReportDesigner.6.exe.settings files at the following location:
C:\Users\user_name\AppData\Roaming\C1Report\
That's it! Now, you have successfully added a map field to your report.
Note that if C1FlexReport definition contains map field and the report is generated asynchronously, the map field cannot be displayed in the FlexViewer control. As a workaround please set the C1FlexViewer.UseAsyncRendering property to False.
FlexReportDesigner allows you to set important properties of the Map custom field. The Properties tab on the left-hand side displays properties for custom map field, such as Layers, Tracking, Styles, Spatial Locations and Legends.
The main part of a map is the tile layer which provides raster graphics representing the Earth surface or part of it, and zero or more layers representing spatial data.
The tile layer is specified by the TileSource property. It may be set to a VirtualEarth tile source (road, aerial, or hybrid). The tile source may be set to "none" in which case no tiles will be drawn on the map. This may be useful especially when other layers such as KML provide enough data for the map visualization.
Note that unless the tile source is "none", the tiles are loaded from a network location when the report runs, which may slow things down considerably.
Except for the tile layer, all other layers are contained in the Layers collection. Currently, three layer types are supported as described below:
kmlItemName=CountryThe map shown by a Map field can automatically center and zoom in on the data shown on the map. This behavior is determined by two factors:
Visual attributes of map elements are mostly defined by styles. There are several types of styles (point marker styles, line styles and KML item styles); the applicable type is determined by the context, such as points layers use point marker styles, lines layers use line styles, and so on. Usually a style may be specified as a data driven expression (so that the actual style depends on run time data), with a fallback style used by default. How style expressions are specified and evaluated is described next.
The Map custom field contains 3 style collections:
These styles are available to all layers defined on the Map, and also to other Map fields in the current report. The styles in each collection are addressable either by index or - preferably - by name (using the Name property). When a style expression evaluates to a string, that string is used to search for a matching style, first in the current map and if that fails, in all other maps on the current report (only matching type styles are searched; for example, only MarkerStyles collections are searched for a point marker style, and so on).
Points and lines layers provide two different ways to specify spatial locations for the data:
As a pair of expressions that evaluate to a longitude/latitude pair at run time. Typically these would directly reference corresponding data fields (longitude and latitude) stored in the data source.
As a MapLocation, an expression (or a list of expressions) that evaluates to a string that can be used to retrieve the corresponding spatial location using an external online service (Google Maps). If the specified MapLocation contains semicolons, it is treated as a list of semicolon-delimited expressions, each of which is evaluated separately and then combined to use as the query. A typical MapLocation could look like this:
"Address;City;PostalCode;Country"which would fetch Address, City, PostalCode, and Country fields from the data source and then combine them to query the external service.
Note that using MapLocation may be very time consuming due to Internet access. Hence by default the retrieved spatial data is stored in a local disk file. The path to that file is specified by the Map.GeoCachePath property. By default the file's name is "geocache.xml", and it is stored in the same directory as the report definition. Disabling geo-caching is not recommended.
A map can have several associated legends, rendered within its bounds. To facilitate placing a legend outside the map's bounds, the legend can be associated with any map field in the report, so you can add an empty map field just to hold a legend describing another map.
Legends are contained within the Legends collection of the Map field. To add a legend, add an item to that collection. The location of a legend within its map's bounds is determined by the LegendAlignment property. Orientation determines whether items within the legend are placed vertically (default) or horizontally. Several other properties allow to fine-tune the way the legend looks.
Items within the legend are represented by the Items collection. That collection may be populated automatically with data from non-KML layers of the current map, if the Automatic property of the legend is set to True. In that case the Items collection cannot be edited. Otherwise, the legend items must be added manually.
The following types of legend items are supported:
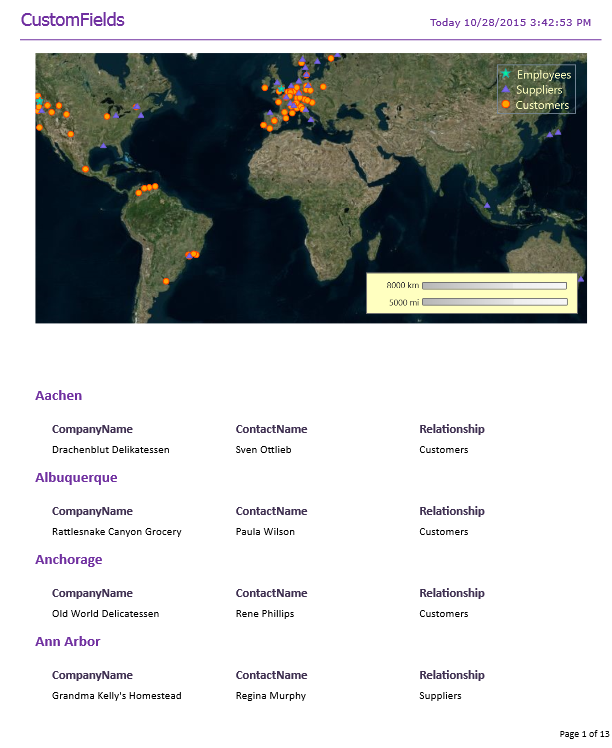
Now that you familiar with the basics of the custom map field, let us see how to add a map field to a report depicting the summary of Employees, Suppliers, and Customers by City.
Complete the following steps:
Add a new report in the designer, with C1NWind.mdb as the data source, with the following SQL query:
Customers and Suppliers by City
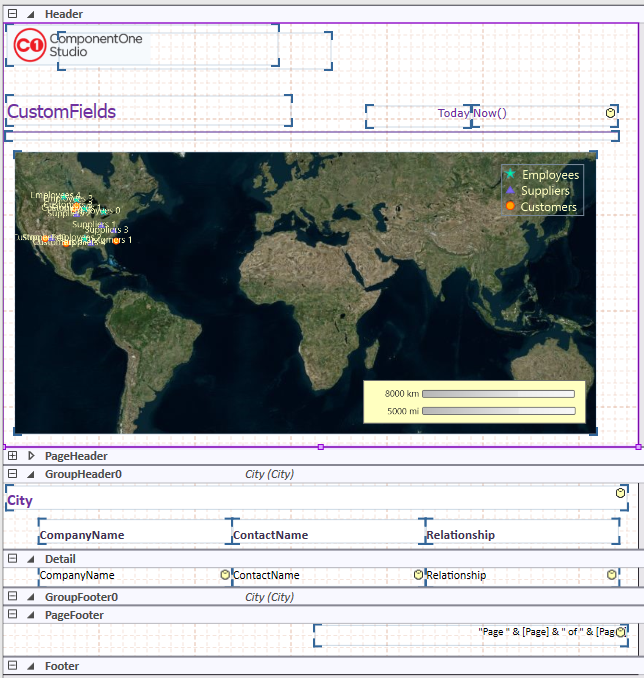
You'll add the map to the report's header:
Set the map's properties as follows (only non-defaults are shown here):
Click ellipsis button next to Layers collection to open LayerBase Collection Editor. Add Members 'Employees', Suppliers', and 'Customers', select the data source and set their marker style and map location properties.
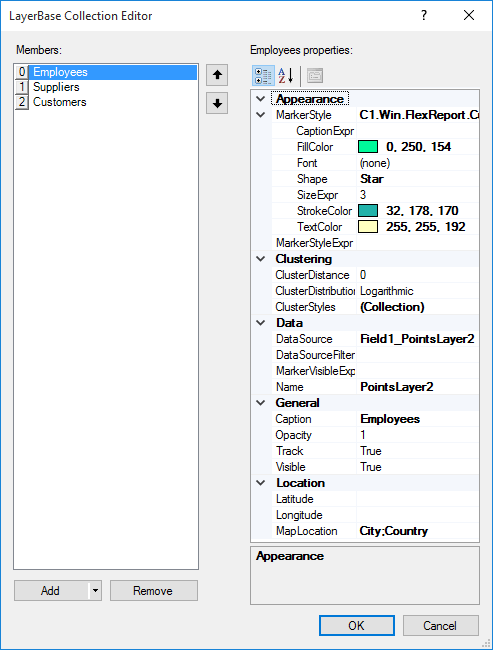
Note that you need to add a data source every time before you add a member to the LayerBase Collection Editor as each member uses different data source.
The design area looks like the following image: