The Chart field of Reports for WinForms has a powerful feature called "aggregated charting". This feature allows you to create charts that automatically aggregate data values (DataY) that have the same category (DataX) using one of the following aggregate functions:
To illustrate this feature, consider an "Invoices" report that groups data by country, customer, and order ID. The general outline for the report is as follows:
|
Report Header section |
|
Page Header section |
|
Group Header section (Country) |
|
Group Header section (Customer) |
|
Group Header section (OrderID) |
|
Detail section |
|
Group Footer section (OrderID) |
|
Group Footer section (Customer) |
|
Group Footer section (Country) |
|
Page Footer section |
|
Report Footer section |
Now imagine that you would like to add a chart to each Country header displaying the total value of all orders placed by each customer in the current country.
You would start you adding a Chart field to the "Country" header section and set the DataX and DataY properties as follows:
DataX = "CustomerName"
DataY = "ExtendedPrice"
This would not work. The data for each country usually includes several records for each customer, and the chart would create one data point for each record. The chart would not be able to guess you really want to add the values for each customer into a single data point.
To address this scenario, we added an Aggregate property to the Chart field. This property tells the chart how to aggregate values that have the same category into a single point in the chart. The Aggregate property can be set to perform any of the common aggregation functions on the data: sum, average, count, maximum, minimum, standard deviation, and variance.
Continuing with our example, we can now simply set the chart's Aggregate property to "Sum". This will cause the chart to add all "ExtendedPrice" values for records that belong to the same customer into a single data point. The result is shown below:
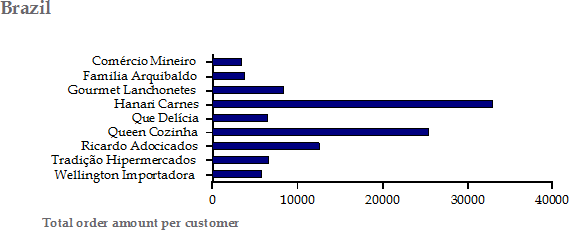
Notice how each customer appears only once. The values shown on the chart correspond to the sum of the "ExtendedPrice" values for all fields with the same "Customer".
Because the chart appears in the "Country" header field, it is repeated for each country, showing all the customers in that country.
If you place the chart in the report header section, it will aggregate data over the entire report. For example, suppose you want to start the "Invoices" report with a chart that shows the total amount ordered by each salesperson. To accomplish this, you would add a Chart field to the report header section and would set the following properties:
DataX = "Salesperson"
DataY = "ExtendedPrice"
Aggregate = "Sum"
The image below shows the resulting chart:
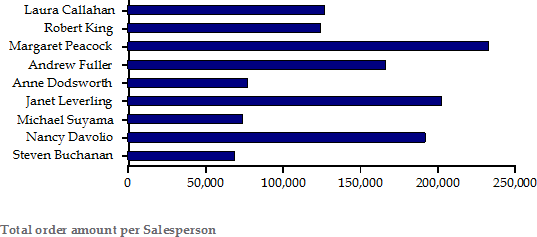
Since the chart is placed in the report header section, the values displayed include all countries and all customers. If you moved the chart field from the report header to the "Country" group header, you would obtain a similar chart for each country, showing the total amounts sold by each salesperson in that country.