The following topic shows how you can create a report definition using the C1ReportDesigner and Using code. Note that creating a report definition is not the same as rendering a report. To render a report, you can simply load an existing definition and call the C1Report.Render method. The easiest way to create a report definition is to use the C1ReportDesigner, which is a stand-alone application similar to the report designer in Microsoft Access.
Creating a Report Definition Using the C1ReportDesigner:
The C1Report Wizard walks you through the steps of creating a new report from start to finish. To begin, complete the following steps:
From the C1Report Wizard, complete the five following steps to create your report:
Select the data source for the new report.
Use this page to select the DataSource.ConnectionString and DataSource.RecordSource that will be used to retrieve the data for the report.
You can specify the DataSource.ConnectionString in three ways:
You can specify the DataSource.RecordSource string in two ways:
Complete Step 1:
Complete the following steps:
select * from products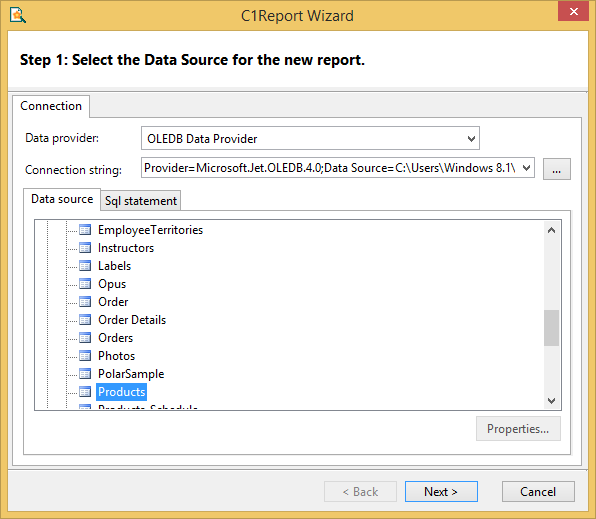
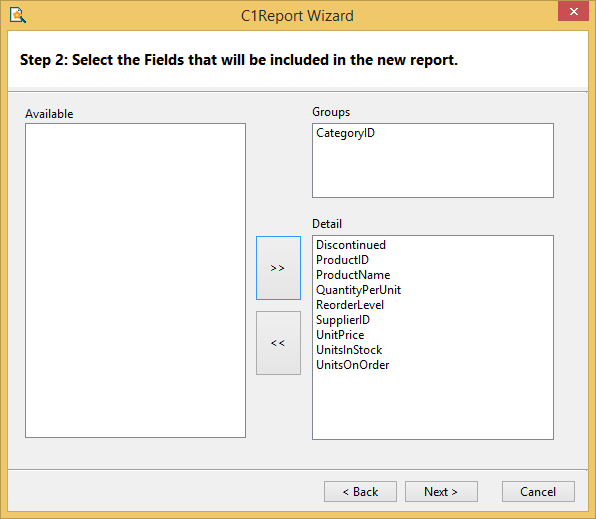
Select the fields you want to include in the report.
This page contains a list of the fields available from the recordset you selected in Step 1, and two lists that define the group and detail fields for the report. Group fields define how the data will be sorted and summarized, and detail fields define what information you want to appear in the report.
You can move fields from one list to another by dragging them with your mouse pointer. Drag fields into the Detail list to include them in the report, or drag within the list to change their order. Drag fields back into the Available list to remove them from the report.
Complete Step 2:
Complete the following steps:
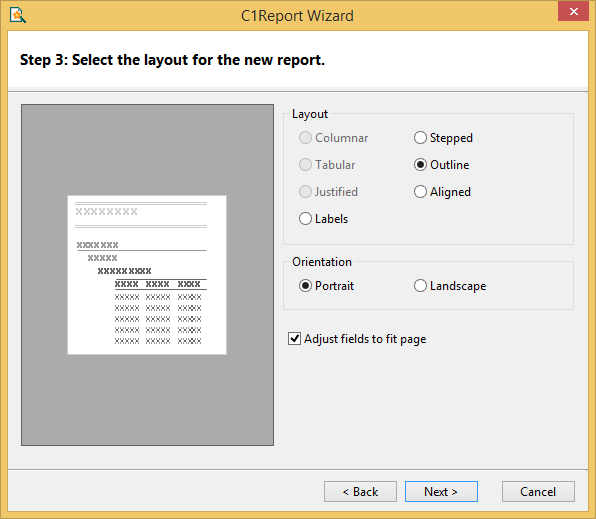
Select the layout for the new report.
This page offers you several options to define how the data will be organized on the page. When you select a layout, a thumbnail preview appears on the left to give you an idea of what the layout will look like on the page. There are two groups of layouts, one for reports that have no groups and one for reports with groups. Select the layout that best approximates what you want the final report to look like.
This page also allows you to select the page orientation and whether fields should be adjusted to fit the page width.
The Labels layout option is used to print Avery-style labels. If you select this option, you will see a page that prompts you for the type of label you want to print.
Complete Step 3:
Complete the following steps:
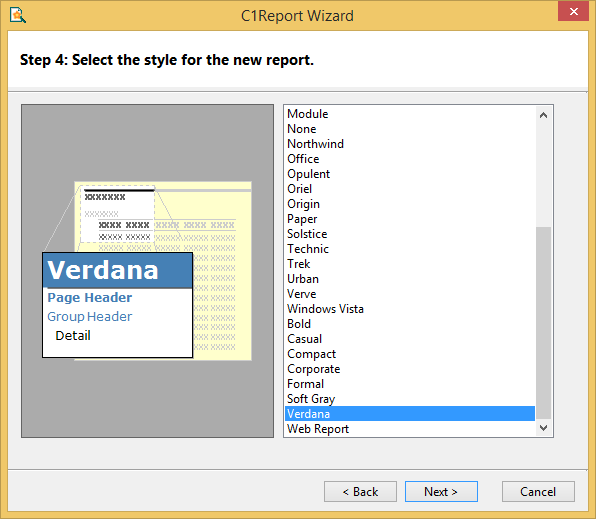
Select the style for the new report.
This page allows you to select the fonts and colors that will be used in the new report. Like the previous page, it shows a preview to give you an idea of what each style looks like. Select the one that you like best (and remember, you can refine it and adjust the details later).
Complete Step 4:
Select the Verdana style.
Click Next. The wizard will walk you through the remaining steps.
Select a title for the new report.
This last page allows you to select a title for the new report and to decide whether you would like to preview the new report right away or whether you would like to go into edit mode and start improving the design before previewing it.
Complete Step 5:
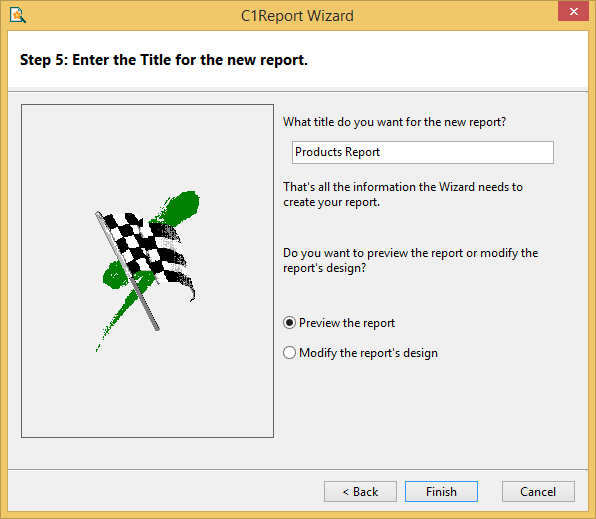
Choose to Preview the report and click Finish.
You will immediately see the report in the preview pane of the Designer.
You will notice that the report will require some adjustments. In the next step, you will learn how to modify the report.
Creating a Report Definition Using Code:
The following steps show how you can create a report definition using the C1ReportDesigner application or using code. You can even write your own report designer or ad-hoc report generator.
The following example uses code to create a simple tabular report definition based on the NorthWind database. The code is commented and illustrates the most important elements of the C1Report object model. Complete the following steps:
Button.Name = btnEmployees
C1Report.Name = c1r
C1PrintPreview.Name = ppv
To write code in Visual Basic
| Visual Basic |
Copy Code
|
|---|---|
Private Sub RenderEmployees() With c1r ' clear any existing fields .Clear() ' set default font for all controls .Font.Name = "Tahoma" .Font.Size = 8 End With |
|
To write code in C#
| C# |
Copy Code
|
|---|---|
private void RenderEmployees()
{
  // clear any existing fields
  c1r.Clear();
  // set default font for all controls
  c1r.Font.Name = "Tahoma";
  c1r.Font.Size = 8;
}
|
|
Next, set up the DataSource object to retrieve the data that you want from the NorthWind database. This is done using the ConnectionString and RecordSource properties (similar to the Microsoft ADO DataControl):
To write code in Visual Basic
| Visual Basic |
Copy Code
|
|---|---|
' initialize DataSource
With c1r.DataSource
  .ConnectionString = "Provider=Microsoft.Jet.OLEDB.4.0;" & _
                      "Data Source=C:\...\ComponentOne Samples\Common\C1NWind.mdb;" & _
                      "Persist Security Info=False"
  .RecordSource = "Employees"
End With
|
|
To write code in C#
| C# |
Copy Code
|
|---|---|
// initialize DataSource DataSource ds = c1r.DataSource; ds.ConnectionString = @"Provider=Microsoft.Jet.OLEDB.4.0;Data Source=C:\...\ComponentOne Samples\Common\C1NWind.mdb;"; ds.RecordSource = "Employees"; |
|
Next, initialize the Layout object that defines how the report will be laid out on the page. In this case, render the report in Portrait mode and set its Width to 6.5 inches (8.5 page width minus one inch for margins on either side):
To write code in Visual Basic
| Visual Basic |
Copy Code
|
|---|---|
' initialize Layout With c1r.Layout .Orientation = OrientationEnum.Portrait .Width = 6.5 * 1440 ' 8.5 - margins, in twips End With |
|
To write code in C#
| C# |
Copy Code
|
|---|---|
// initialize Layout Layout l = c1r.Layout; l.Orientation = OrientationEnum.Portrait; l.Width = 6.5 * 1440; // 8.5 - margins, in twips |
|
Now comes the interesting part. Every report has five basic sections: Detail, Report Header, Report Footer, Page Header, and Page Footer. Use the following code to set up the report header by setting a couple of properties and adding a title field to it:
To write code in Visual Basic
| Visual Basic |
Copy Code
|
|---|---|
' variable used to create and format report fields
Dim f As Field

' create a report header
 With c1r.Sections(SectionTypeEnum.Header)
  .Height = 1440
  .Visible = True
  .BackColor = Color.FromArgb(200, 200, 200)
  f = .Fields.Add("FldTitle", "Employees Report", 0, 0, 8000, 1440)
  f.Font.Size = 24
  f.Font.Bold = True
  f.ForeColor = Color.FromArgb(0, 0, 100)
End With
|
|
To write code in C#
| C# |
Copy Code
|
|---|---|
// variable used to create and format report fields
 Field f;

// create a report header
Section s = c1r.Sections[SectionTypeEnum.Header];
  s.Height = 1440;
  s.Visible = true;
  s.BackColor = Color.FromArgb(200, 200, 200);
  f = s.Fields.Add("FldTitle", "Employees Report", 0, 0, 8000, 1440);
  f.Font.Size = 24;
  f.Font.Bold = true;
  f.ForeColor = Color.FromArgb(0, 0, 100);
|
|
The section object has a Fields collection. The collection's Add method creates a new field and assigns it to the Section. The parameters specify the new field's Name, Text, Left, Top, Width, and Height properties. By default, the field has the same font as the control. Since this is a title, it makes sense to change the font and make it larger. Note that the field should be tall enough to accommodate the font size, or nothing will appear in it.
Next, set up the Page Footer Section. This section is more interesting because it contains calculated fields. Calculated fields contain VBScript expressions in their Text property, which are evaluated when the report is rendered. To make a field calculated, set its Calculated property to True. To create a page footer, add the following code:
To write code in Visual Basic
| Visual Basic |
Copy Code
|
|---|---|
' create a page footer
With c1r.Sections(SectionTypeEnum.PageFooter)
  .Height = 500
  .Visible = True
  f = .Fields.Add("FldFtrLeft", """Employees: Printed on "" & Now",_
                  0, 0, 4000, 300)
  f.Calculated = True
  f = .Fields.Add("FldFtrRight", """Page "" & Page & "" of "" & Pages",_
                  4000, 0, 4000, 300)
  f.Calculated = True
  f.Align = FieldAlignEnum.RightTop
  f.Width = c1r.Layout.Width - f.Left
  f = .Fields.Add("FldLine", "", 0, 0, c1r.Layout.Width, 20)
  f.LineSlant = LineSlantEnum.NoSlant
  f.BorderStyle = BorderStyleEnum.Solid
  f.BorderColor = Color.FromArgb(0, 0, 100)
End With
|
|
To write code in C#
| C# |
Copy Code
|
|---|---|
// create a page footer
s = c1r.Sections[SectionTypeEnum.PageFooter];
  s.Height = 500;
  s.Visible = true;
  f = s.Fields.Add("FldFtrLeft", @"""Employees: Printed on "" & Now",_
                  0, 0, 4000, 300);
  f.Calculated = true;
  f = .Fields.Add("FldFtrRight", @"""Page "" + Page + "" of "" & Pages",_
                  4000, 0, 4000, 300);
  f.Calculated = true;
  f.Align = FieldAlignEnum.RightTop;
  f.Width = c1r.Layout.Width - f.Left;
  f = s.Fields.Add("FldLine", "", 0, 0, c1r.Layout.Width, 20);
  f.LineSlant = LineSlantEnum.NoSlant;
  f.BorderStyle = BorderStyleEnum.Solid;
  f.BorderColor = Color.FromArgb(0, 0, 100);
|
|
The Page Footer section uses expressions with variables that are not intrinsic to VBScript, but are defined by C1Report. Page and Pages are variables that contain the current page number and the total page count. The section also uses a field configured to look like a line. This is done using the BorderStyle and LineSlant properties.
Next, set up the Page Header Section. This section gets rendered at the top of every page and will display the field labels. Using a Page Header section to display field labels is a common technique in tabular reports. The code is simple, but looks a bit messy because of all the field measurements. In a real application, these values would not be hard-wired into the program. To create a page header with field labels, add the following code:
To write code in Visual Basic
| Visual Basic |
Copy Code
|
|---|---|
' create a page header with field labels
With c1r.Sections(SectionTypeEnum.PageHeader)
  .Height = 500
  .Visible = True
  c1r.Font.Bold = True
  f = .Fields.Add("LblID", "ID", 0, 50, 400, 300)
  f.Align = FieldAlignEnum.RightTop
  f = .Fields.Add("LblFirstName", "First", 500, 50, 900, 300)
  f = .Fields.Add("LblLastName", "Last", 1500, 50, 900, 300)
  f = .Fields.Add("LblTitle", "Title", 2500, 50, 2400, 300)
  f = .Fields.Add("LblTitle", "Notes", 5000, 50, 8000, 300)
  c1r.Font.Bold = False
  f = .Fields.Add("FldLine", "", 0, 400, c1r.Layout.Width, 20)
  f.LineSlant = LineSlantEnum.NoSlant
  f.LineWidth = 50

  f.BorderColor = Color.FromArgb(100, 100, 100)
End With
|
|
To write code in C#
| C# |
Copy Code
|
|---|---|
// create a page header with field labels   v
s = c1r.Sections[SectionTypeEnum.PageHeader];
  s.Height = 500;
  s.Visible = true;
  c1r.Font.Bold = true;
  f = s.Fields.Add("LblID", "ID", 0, 50, 400, 300);
  f.Align = FieldAlignEnum.RightTop;
  f = s.Fields.Add("LblFirstName", "First", 500, 50, 900, 300);
  f = s.Fields.Add("LblLastName", "Last", 1500, 50, 900, 300);
  f = s.Fields.Add("LblTitle", "Title", 2500, 50, 2400, 300);
  f = s.Fields.Add("LblTitle", "Notes", 5000, 50, 8000, 300);
  c1r.Font.Bold = false;
  f = s.Fields.Add("FldLine", "", 0, 400, c1r.Layout.Width, 20);
  f.LineSlant = LineSlantEnum.NoSlant;
  f.LineWidth = 50;
  f.BorderColor = Color.FromArgb(100, 100, 100);
|
|
This code illustrates a powerful technique for handling fonts. Since every field inherits the control font when it is created, set the control's Font. Bold property to True before creating the fields, and set it back to False afterwards. As a result, all controls in the Page Header section have a bold font.
To finalize the report, add the Detail Section. This is the section that shows the actual data. It has one calculated field below each label in the Page Header Section. To create the Detail section, add the following code:
To write code in Visual Basic
| Visual Basic |
Copy Code
|
|---|---|
' create the Detail section
With c1r.Sections(SectionTypeEnum.Detail)
  .Height = 330
  .Visible = True
  f = .Fields.Add("FldID", "EmployeeID", 0, 0, 400, 300)
  f.Calculated = True
  f = .Fields.Add("FldFirstName", "FirstName", 500, 0, 900, 300)
  f.Calculated = True
  f = .Fields.Add("FldLastName", "LastName", 1500, 0, 900, 300)
  f.Calculated = True
  f = .Fields.Add("FldTitle", "Title", 2500, 0, 2400, 300)
  f.Calculated = True
  f = .Fields.Add("FldNotes", "Notes", 5000, 0, 8000, 300)
  f.Width = c1r.Layout.Width - f.Left
  f.Calculated = True
  f.CanGrow = True
  f.Font.Size = 6
  f.Align = FieldAlignEnum.JustTop
  f = .Fields.Add("FldLine", "", 0, 310, c1r.Layout.Width, 20)
  f.LineSlant = LineSlantEnum.NoSlant
  f.BorderStyle = BorderStyleEnum.Solid
  f.BorderColor = Color.FromArgb(100, 100, 100)
End With
|
|
To write code in C#
| C# |
Copy Code
|
|---|---|
// create the Detail section
s = c1r.Sections[SectionTypeEnum.Detail];
  s.Height = 330;
  s.Visible = true;
  f = s.Fields.Add("FldID", "EmployeeID", 0, 0, 400, 300);
  f.Calculated = true;
  f = s.Fields.Add("FldFirstName", "FirstName", 500, 0, 900, 300);
  f.Calculated = true;
  f = s.Fields.Add("FldLastName", "LastName", 1500, 0, 900, 300);
  f.Calculated = true;
  f = s.Fields.Add("FldTitle", "Title", 2500, 0, 2400, 300);
  f.Calculated = true;
  f = s.Fields.Add("FldNotes", "Notes", 5000, 0, 8000, 300);
  f.Width = c1r.Layout.Width - f.Left;
  f.Calculated = true;
  f.CanGrow = true;
  f.Font.Size = 6;
  f.Align = FieldAlignEnum.JustTop;
  f = s.Fields.Add("FldLine", "", 0, 310, c1r.Layout.Width, 20);
  f.LineSlant = LineSlantEnum.NoSlant;
  f.BorderStyle = BorderStyleEnum.Solid;
  f.BorderColor = Color.FromArgb(100, 100, 100);
|
|
Note that all fields are calculated, and their Text property corresponds to the names of fields in the source recordsetsource. Setting the Calculated property to True ensures that the Text property is interpreted as a database field name, as opposed to being rendered literally. It is important to adopt a naming convention for report fields that makes them unique, different from recordset field names. If you had two fields named "LastName", an expression such as "Left(LastName,1)" would be ambiguous. This example has adopted the convention of beginning all report field names with "Fld".
Note also that the "FldNotes" field has its CanGrow property set to True, and a smaller font than the others. This was done to make sure that the "Notes" field in the database, which contains a lot of text, will appear in the report. Rather than make the field very tall and waste space, setting the CanGrow property to True tells the control to expand the field as needed to fit its contents; it also sets the containing section's CanGrow property to True, so the field doesn't spill off the Section.
The report definition is done. To render the report into the C1PrintPreview control, double-click the Employees button to add an event handler for the btnEmployees_Click event. The Code Editor will open with the insertion point placed within the event handler. Enter the following code:
To write code in Visual Basic
| Visual Basic |
Copy Code
|
|---|---|
RenderEmployees() ' render the report into the C1PrintPreview control ppv.Document = c1r.Document |
|
To write code in C#
| C# |
Copy Code
|
|---|---|
RenderEmployees(); // render the report into the C1PrintPreview control ppv.Document = c1r.Document; |
|
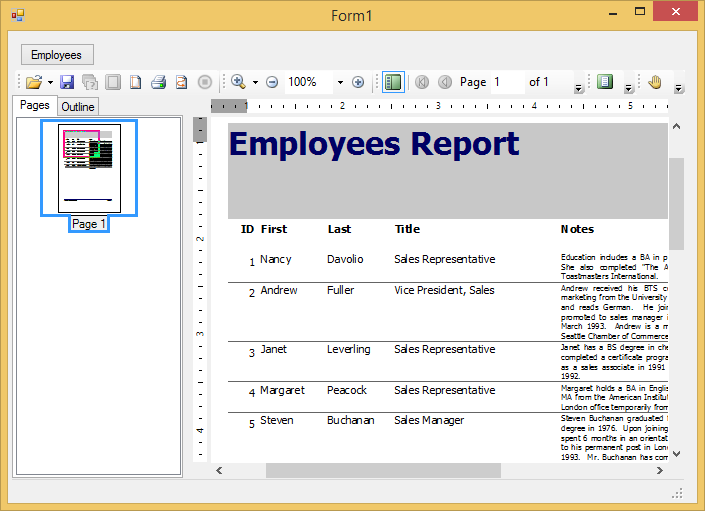
Here's what the basic report looks like: