Box-and-Whisker charts are the statistical charts that display the distribution of numerical data through quartiles, means and outliers. As the name suggests, these values are represented using boxes and whiskers where boxes show the range of quartiles (lower quartile, upper quartile and median) while whiskers indicate the variability outside the upper and lower quartiles. Any point outside the whiskers is said to be an outlier. These charts are useful for comparing distributions between many groups or data sets. For instance, you can easily display the variation in monthly temperature of two cities.
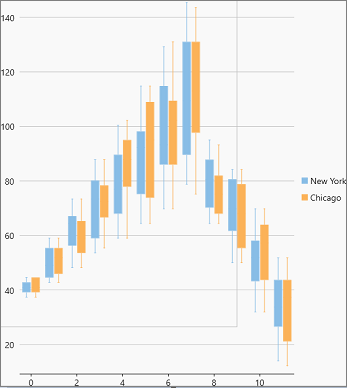
In FlexChart, Box-and-Whisker can be implemented using the BoxWhisker class which represents a Box-and-Whisker series. Apart from other series related properties, this class provides properties specific to Box-and-Whisker series such as the QuartileCalculation property, which lets you specify whether to include the median in quartile calculation or not. This property accepts the values from QuartileCalculation enumeration. FlexChart also provides options to specify whether to display outliers, inner points, mean line and mean marks through ShowOutliers, ShowInnerPoints, ShowMeanLine and ShowMeanMarks properties respectively. To create a box-and-whisker chart through code, first configure the X and Y axes by setting the Binding property. You also need to set up the chart by setting other required properties.
Following XAML code is required to create the Box and Whisker chart using the Flex chart :
| XAML |
Copy Code
|
|---|---|
<c1:FlexChart x:Name="flexChart" Binding="Value,Name" Height="650"/> |
|
Following C# code is required to create the Box and Whisker chart:
| CS |
Copy Code
|
|---|---|
public sealed partial class BoxWhisker : UserControl { public BoxWhisker() { this.InitializeComponent(); var data = GetTemperatureData(new string[] { "New York", "Chicago" }, false, 365, true); foreach (CityDataItem item in data) { var ds = item.Data.GroupBy(x => x.Date.Month).SelectMany(grp => grp).OrderBy(x => x.Date.Day).Select(x => new Point { X = x.Date.Month - 1, Y = x.HighTemp }).ToList(); C1.WinUI.Chart.BoxWhisker boxWhisker = new C1.WinUI.Chart.BoxWhisker() { SeriesName = item.Name, ItemsSource = ds, BindingX = "X", Binding = "Y", QuartileCalculation = QuartileCalculation.InclusiveMedian, }; this.flexChart.Series.Add(boxWhisker); } } private Random rnd = new Random(); public List<CityDataItem> GetTemperatureData(string[] cities, bool monthly = false, int count = 30, bool isFahrenheit = false) { var data = new List<CityDataItem>(); var startDate = new DateTime(2017, 1, 1); foreach (string city in cities) { var dataItem = new CityDataItem() { Name = city }; for (int i = 0; i < count; i++) { var temp = new Temperature(); DateTime date; if (monthly) date = startDate.AddMonths(i); else date = startDate.AddDays(i); temp.Date = date; if (date.Month <= 8) temp.HighTemp = rnd.Next(3 * date.Month, 8 * date.Month); else temp.HighTemp = rnd.Next((13 - date.Month - 2) * date.Month, (13 - date.Month) * date.Month); temp.LowTemp = temp.HighTemp - rnd.Next(6, 8); temp.Precipitation = (date.Month < 4 || date.Month > 8) ? rnd.Next(100, 150) : rnd.Next(150, 200); if (isFahrenheit) temp.HighTemp = temp.HighTemp * 1.8 + 32; dataItem.Data.Add(temp); } data.Add(dataItem); } return data; } } public class CityDataItem { private List<Temperature> _data; public string Name { get; set; } public List<Temperature> Data { get { if (_data == null) { _data = new List<Temperature>(); } return _data; } } } public class Temperature { public DateTime Date { get; set; } public double HighTemp { get; set; } public double LowTemp { get; set; } public double Precipitation { get; set; } } |
|