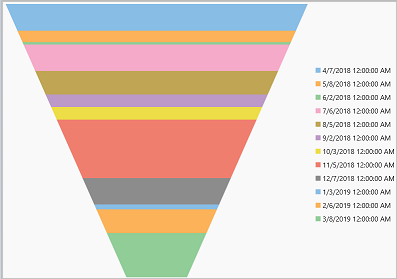
Funnel charts are the charts that help in visualizing the sequential stages in a linear process such as order fulfillment. In such processes, each stage represents a proportion (percentage) of the total. Therefore, the chart takes the funnel shape with the first stage being the largest and each following stage smaller than the predecessor. Funnel charts are useful in identifying potential problem areas in processes where it is noticeable at what stages and rate the values decrease. For instance, a an order fulfillment process that tracks number of orders getting across a stage, such as orders received, processed, approved, released, shipped, completed and finally delivered.
With FlexChart, you can create a funnel chart by simply setting the ChartType property to ChartType.Funnel. The following code demonstrates the code to create a funnel chart. This example uses the same datasource and custom method named GetProductRevenue used in the Quick Start topic.
| XAML |
Copy Code
|
|---|---|
<c1:FlexChart x:Name="flexChart" Grid.Row="1" BindingX="Date" ChartType="Funnel"> <c1:FlexChart.Series> <c1:Series SeriesName="Sales" Binding="Revenue"/> </c1:FlexChart.Series> </c1:FlexChart> |
|