Histograms are visual representation of data distribution over a continuous interval or certain time period. These charts comprise of vertical bars to indicate the frequency in each interval or bin created by dividing the raw data values into a series of consecutive and non-overlapping intervals. Hence, histograms help in estimating the range where maximum values fall as well as in knowing the extremes and gaps in data values, if there are any. For instance, histogram can help you find the range of height in which maximum students of a particular age group fall.
With FlexChart, you can create a histogram by simply setting the ChartType property to ChartType.Histogram. Once data is provided, FlexChart automatically calculates the bins to group the data and create a histogram. However, if required, you can also set width of these bins by setting the BinWidth property. To create a cumulative histogram, you need to set the CumulativeMode property to true.
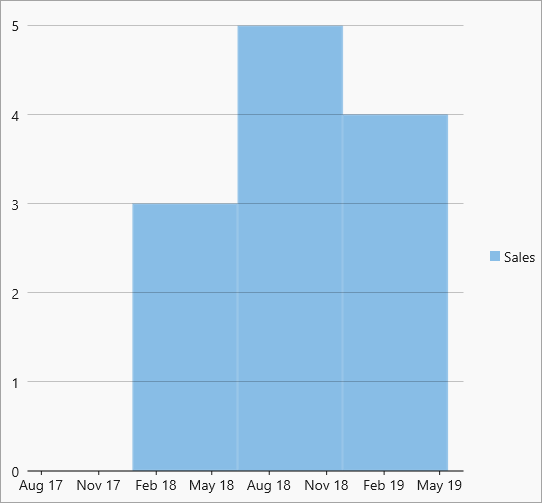
The following code demonstrates the code to create a histogram. This example uses the same datasource and custom method named GetProductRevenue used in the Quick Start topic.
| XAML |
Copy Code
|
|---|---|
<c1:FlexChart x:Name="flexChart" Grid.Row="1" BindingX="Date" ChartType="Histogram"> <c1:FlexChart.Series> <c1:Series SeriesName="Sales" Binding="Revenue"/> </c1:FlexChart.Series> </c1:FlexChart> |
|