Plot area is the area of chart where data points are plotted. In a chart having X and Y axis, plot area also refers to the area covered by the axes. In a chart like pie chart or sunburst chart, plot area refers to the circular area actually covered by the chart itself.
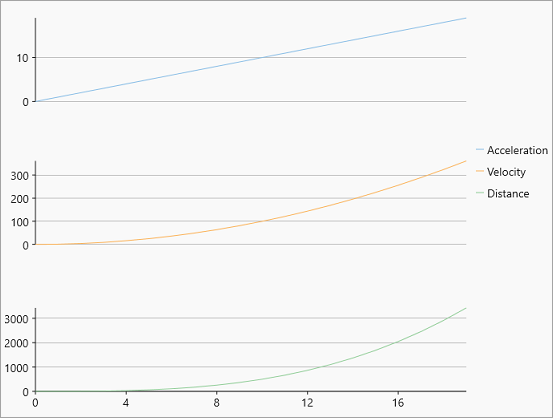
Multiple plot areas are preferred over multiple overlapped series as they increase the readability of data and hence facilitate better analysis. Drawing multiple series, one in each plot area while sharing some of the chart resources like axes, legend etc. is helpful in scenarios like the one shown in the below chart which demonstrates change in acceleration, velocity and distance against time series. In FlexChart, multiple plot areas can be implemented by adding the plot areas to the PlotAreas collection and while defining the series, specify the plot name in which the same has to be rendered.
The following image showcases the multiple plot area.
To create multiple plot areas, follow these steps:
| XAML |
Copy Code
|
|---|---|
<c1:FlexChart x:Name="flexChart" BindingX="X" ChartType="Line" Height="650"></c1:FlexChart> |
|
| C# |
Copy Code
|
|---|---|
flexChart.PlotAreas.Add(new PlotArea { PlotAreaName = "plot1", Row = 1 }); flexChart.PlotAreas.Add(new PlotArea { PlotAreaName = "plot2", Row = 3 }); flexChart.PlotAreas.Add(new PlotArea { PlotAreaName = "plot3", Row = 5 }); //Create new series for Acceleration and set PlotAreaName specifying in which plot to render this series var acceleration = new Series { SeriesName = "Acceleration", ItemsSource = CreateDataPoints((x) => x, (y) => y, 20), AxisY = new Axis { Position = Position.Left, MajorGrid = true, PlotAreaName = "plot1" }, Binding = "Y" }; this.flexChart.Series.Add(acceleration); //Create new series for Velocity and set PlotAreaName specifying in which plot to render this series var velocity = new Series { SeriesName = "Velocity", ItemsSource = CreateDataPoints((x) => x, (y) => y * y, 20), AxisY = new Axis { Position = Position.Left, MajorGrid = true, PlotAreaName = "plot2" }, Binding = "Y" }; this.flexChart.Series.Add(velocity); //Create new series for distance and set PlotAreaName specifying in which plot to render this series var distance = new Series { SeriesName = "Distance", ItemsSource = CreateDataPoints((x) => x, (y) => 0.5 * y * y * y, 20), AxisY = new Axis { Position = Position.Left, MajorGrid = true, PlotAreaName = "plot3" }, Binding = "Y" }; this.flexChart.Series.Add(distance); |
|
| C# |
Copy Code
|
|---|---|
public static List<Point> CreateDataPoints(Func<double, double> funX, Func<double, double> funY, int count) { var data = new List<Point>(); for (int i = 0; i < count; i++) { data.Add(new Point { X = funX(i), Y = funY(i), }); } return data; } |
|