Sunburst, also known as a multi-level pie chart, is ideal for visualizing multi-level hierarchical data depicted by concentric circles. The circle in the center represents the root node surrounded by the rings representing different levels of hierarchy. Rings are divided based on their relationship with the parent slice with each of them either divided equally or proportional to a value. For instance, you can use sunburst to display sales over past few years or to display makes or models of a product.
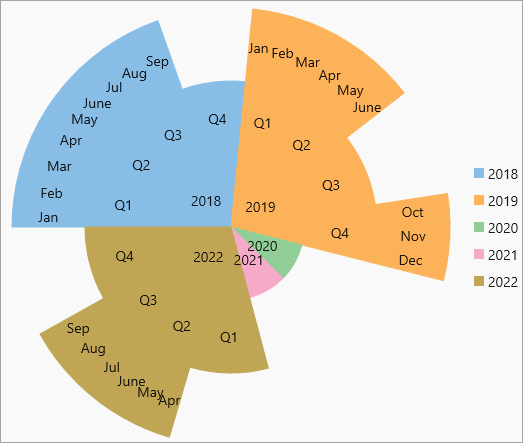
FlexChart provides sunburst chart through a stand alone Sunburst control which is represented by the C1Sunburst class. To create a sunburst chart through code, the first step after initializing the control is to configure the chart by setting the Binding and BindingName property. These properties are used for setting the numeric values and labels of the sunburst slices. Then, you need to set the ChildItemsPath property to generate child items in hierarchical data as showcased in the following XAML code:
| XAML |
Copy Code
|
|---|---|
<c1:C1Sunburst x:Name="sunBurst" Binding="Value" BindingName="Year,Quarter,Month" ChildItemsPath="Items" Height="650"> <c1:C1Sunburst.DataLabel> <c1:PieDataLabel Content="{}{name}" Position="Center"/> </c1:C1Sunburst.DataLabel> </c1:C1Sunburst> |
|
Following C# code sets up the data using ItemsSource property and uses a custom method named GetSunburstData to supply data to the chart. This code uses the same datasource which is used in Quick Start. You can set up the data source as per your requirements.
| C# |
Copy Code
|
|---|---|
sunBurst.ItemsSource = DataService.GetSunburstData(); |
|