Adding a TrendLine is very similar to adding a second data series. C1Chart will automatically calculate and plot the trendline based on the values. By default, a trendline will have a Polynomial FitType with and Order of 2. The following code demonstrates adding a TrendLine:
| Visual Basic |
Copy Code
|
|---|---|
'add trend line Dim tl As New TrendLine() tl.Label = "Trendline" tl.ConnectionStroke = New SolidColorBrush(Colors.Red) tl.XValuesSource = myXValues tl.ValuesSource = myValues chart.Data.Children.Add(tl) |
|
| C# |
Copy Code
|
|---|---|
//add trend line TrendLine tl = new TrendLine(); tl.Label = "Trendline"; tl.ConnectionStroke = new SolidColorBrush(Colors.Red); tl.XValuesSource = myXValues; tl.ValuesSource = myValues; chart.Data.Children.Add(tl); |
|
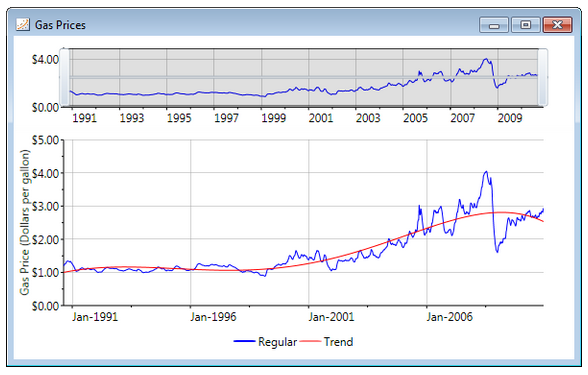
You can see in the following image that the default trendline doesn't fit the data closely:

You can get a better fit by changing the Order property. You can specify both the FitType and the Order properties to get the fit you're looking for:
| C# |
Copy Code
|
|---|---|
TrendLine tl = new TrendLine(); tl.Label = "Trend"; tl.FitType = FitType.Polynom; tl.Order = 6; |
|
The data used in the pictured chart graphs gas prices with values taken every seven days. With this kind of data, a MovingAverage trendline is more appropriate. You can see how it fits the data in the following image:
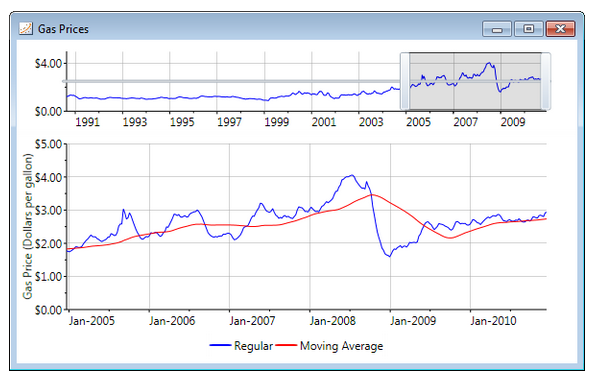
When setting up a Moving Average trendline, you must instantiate a new MovingAverage object and set the Period property. This property specifies the number of data points to use for the trendline. Since the gas price data is averaged every 7 days, a Period of 48 averages each year of data:
| C# |
Copy Code
|
|---|---|
MovingAverage ma = new MovingAverage(); ma.Label = "Moving Average"; ma.Period = 48; ma.XValuesSource = days; ma.ValuesSource = price; ma.ConnectionStroke = new SolidColorBrush(Colors.Red); chart.Data.Children.Add(ma); |
|