In some situations you may need to create custom axis annotation. The following scenarios can be useful for creating custom axis annotation:
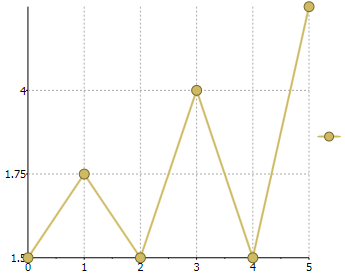
C# Here is what the chart appears like after adding the preceding code:
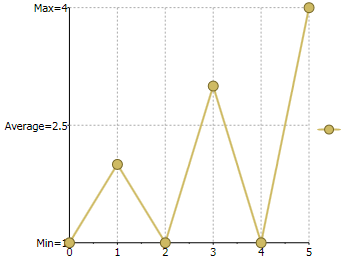
C# Here is what the chart appears like after adding the preceding code:
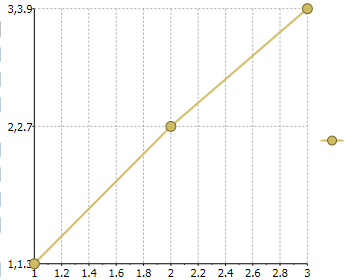
C# Here is what the chart appears like after adding the preceding code: