An Area chart draws each series as connected points of data, filled below the points. Each series is drawn on top of the preceding series. The series can be drawn independently or stacked. In WPF, you can also create 3D Area charts. Chart for WPF and Silverlight supports the following types of Area charts:
You can use the following markup to create an Area chart:
| XAML |
Copy Code
|
|---|---|
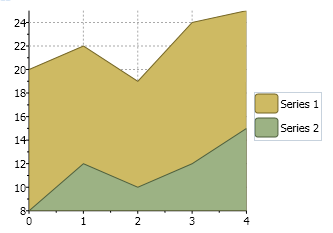
<c1:C1Chart ChartType="Area" > <c1:C1Chart.Data> <c1:ChartData ItemNames="P1 P2 P3 P4 P5"> <c1:DataSeries Label="Series 1" Values="20 22 19 24 25" /> <c1:DataSeries Label="Series 2" Values="8 12 10 12 15" /> </c1:ChartData> </c1:C1Chart.Data> <c1:C1ChartLegend DockPanel.Dock="Right" /> </c1:C1Chart> |
|
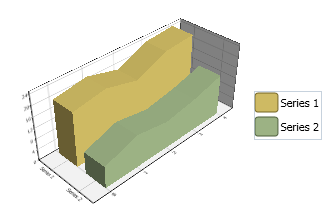
3D Area Charts (WPF Only)
Use the AreaShape3D class to access data points associated with the plot elements in the 3D Area chart, get the value of the plot element when the mouse cursor is over it, get or set the size of plot elements in pixels, specify whether points are connected with smoothed lines. The following types of 3D Area charts are available in WPF:
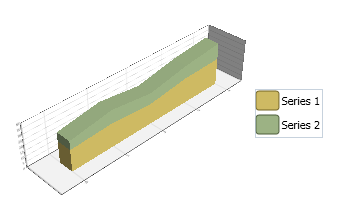
| Area3D | Area3Dstacked |
 |
 |
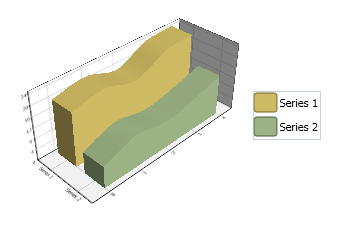
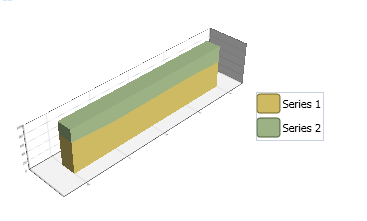
| Area3Dsmoothed | Area3Dstacked100pc |
 |
 |
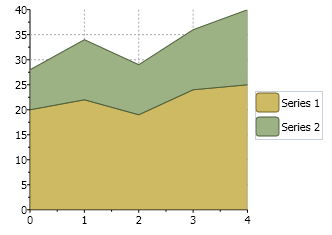
Standard Area Charts (WPF and Silverlight)
| Area | AreaStacked |
 |
 |
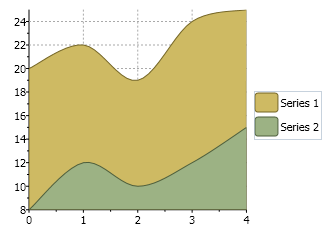
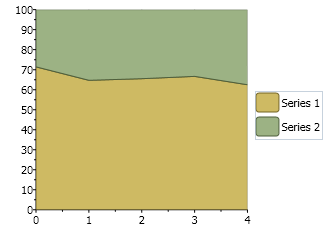
| AreaSmoothed | AreaStacked100pc |
 |
 |