ComponentOne Chart for WPF and Silverlight
Chart for WPF and Silverlight / Tutorials / Data Binding Tutorials / Bind to an XML
In This Topic
    Bind to an XML
    In This Topic

     This tutorial provides step-by-step instructions for embedding the XML as a data island within the source of the XAML page to bind the C1Chart control to the xml data. The data shows the information as a simple bar chart with one y-axis that represents the names of the cities and one x-axis that represents the population for each country. The Bar chart uses one series to draw the population. A legend is used to show the color for the population.

    In this tutorial the binding is set in the ChartData class using the following XAML code:

    XAML
    Copy Code
    <c1chart:ChartData ItemsSource="{Binding Source={StaticResource data}}"
       ItemNameBinding="{Binding XPath=CityName}">
         <c1chart:DataSeries Label="Population"
           ValueBinding="{Binding XPath=Population}" />
    </c1chart:ChartData>
    

    Completing this tutorial will produce a chart that looks like the following:


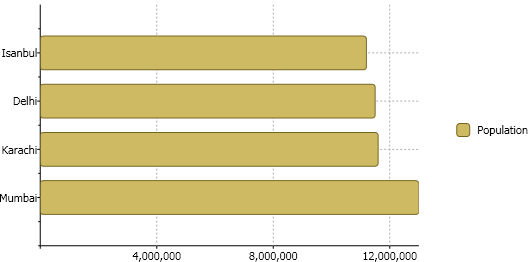
    To bind C1Chart to xml:

    1. Create a new WPF project in Visual Studio. For more information about creating a WPF project, see Getting Started with WPF Edition.
    2. Create a Resource section in your Window and add an XML data provider to it. Within the resources section embed the XML data directly as an XML data island. An XML data island must be wrapped in <x:Xdata> tags and always have a single root node, which is Cities in this example:
    XAML
    Copy Code
    <Grid.Resources>
          <XmlDataProvider x:Key="data" XPath="Cities/City">
            <x:XData>
              <Cities xmlns="">
                <City>
                  <CityName>Mumbai</CityName>
                  <Population>13000000</Population>
                </City>
                <City>
                  <CityName>Karachi</CityName>
                  <Population>11600000</Population>
                </City>
                <City>
                  <CityName>Delhi</CityName>
                  <Population>11500000</Population>
                </City>
                <City>
                  <CityName>Istanbul</CityName>
                  <Population>11200000</Population>
                </City>
              </Cities>
            </x:XData>
          </XmlDataProvider>
    </Grid.Resources>
    
    1. Add the C1.WPF.C1Chart reference to your project.
    2. Add the C1Chart control to the Window.

    Once the C1Chart control is placed on the Window, the following XAML code is added:

    XAML
    Copy Code
    Title="Window1" Height="50" Width="100" xmlns:c1chart="clr-namespace:C1.WPF.C1Chart;assembly=C1.WPF.C1Chart" Loaded="Window_Loaded">
        <Grid>
            <c1chart:C1Chart Content="" Margin="10,10,10,18" Name="c1Chart1">
                <c1chart:C1Chart.Data>
                    <c1chart:ChartData>
                        <c1chart:ChartData.ItemNames>P1 P2 P3 P4 P5</c1chart:ChartData.ItemNames>
                        <c1chart:DataSeries Label="Series 1" Values="20 22 19 24 25" />
                        <c1chart:DataSeries Label="Series 2" Values="8 12 10 12 15" />
                    </c1chart:ChartData>
                </c1chart:C1Chart.Data>
                <c1chart:Legend DockPanel.Dock="Right" />
            </c1chart:C1Chart>
        </Grid>
    
    1. Change the Window's Width to "300" and Height to "550"
    2. Within the <c1chart:C1Chart> tag modify the Margin to "0" and set the ChartType to "Bar". This will change the default chart's appearance from Column to Bar. Your XAML code should appear like the following:
    XAML
    Copy Code
    <c1chart:C1Chart Margin="0" Name="c1Chart1" ChartType="Bar">
              
    </c1chart:C1Chart>
    
    1. In the XAML file locate the <c1chart:C1Chart.Data> tag and delete the following XAML code from it:
    XAML
    Copy Code
    <c1chart:ChartData.ItemNames>P1 P2 P3 P4 P5</c1chart:ChartData.ItemNames>
            <c1chart:DataSeries Label="Series 1" Values="20 22 19 24 25" />
            <c1chart:DataSeries Label="Series 2" Values="8 12 10 12 15" />
    

    The two default series are removed from C1Chart and now the C1Chart control appears empty because there is no data for it.

    1. Within the <c1chart:C1Chart.Data> tag add the ItemNameBinding property to the ChartData to specify the name of the element, in this case the label on the y-axis and the ValueBinding property to the DataSeries to specify the numerical value for the series. The following example binds the ChartData.ItemsSource property using the binding extension, specifying the Source. The ChartData.ItemNameBinding property is bound using the binding extension specifying the Path. The DataSeries.Label property is bound using the binding extension to specify the Path which is the Population.
    XAML
    Copy Code
    <c1chart:ChartData ItemsSource="{Binding Source={StaticResource data}}"
                          ItemNameBinding="{Binding XPath=CityName}">
              <c1chart:DataSeries Label="Population" ValueBinding="{Binding XPath=Population}" />
    </c1chart:ChartData>
    

    Your XAML code for your C1Chart control should look like the following:

    XAML
    Copy Code
    <c1chart:C1Chart Height="300"  HorizontalAlignment="Left" Margin="0" Name="c1Chart1" ChartType="Bar" VerticalAlignment="Top" Width="500">
                <c1chart:C1Chart.Data>
                    <c1chart:ChartData ItemsSource="{Binding Source={StaticResource data}}"
                          ItemNameBinding="{Binding XPath=CityName}">
                        <c1chart:DataSeries Label="Population"
                             ValueBinding="{Binding XPath=Population}" />
                    </c1chart:ChartData>
                </c1chart:C1Chart.Data>
                <c1chart:Legend DockPanel.Dock="Right" />
    </c1chart:C1Chart>
    
    1. Run your project to ensure that everything is working correctly.
      Your chart will appear like the following: 


    Notice how the annotation appears for the x-axis. We will need to format the annotation for the x-axis so the population appears in the thousandths.

    1.  Declare tags for C1Chart's ChartView.AxisX property. You will need to set the following properties of the AxisX to format the annotation and the gridlines.

    Add the following XAML code after the closing, </c1chart:C1Chart.Data>, tag:

    XAML
    Copy Code
    <c1chart:C1Chart.View>
            <c1chart:ChartView>
              <c1chart:ChartView.AxisX >
                <c1chart:Axis Min="0" MajorGridStroke="DarkGray" AnnoFormat="#,###,###"/>
              </c1chart:ChartView.AxisX>
            </c1chart:ChartView>
    </c1chart:C1Chart.View>
    

     The X-Axis annotation appears updated on the Chart like the following:


    See Also