You can add animation when you click on any column in the Column chart, using MouseDown and MouseLeave events, like the following XAML markup:
| XAML |
Copy Code
|
|---|---|
<Window x:Class="MouseEvent.Window1" xmlns="http://schemas.microsoft.com/winfx/2006/xaml/presentation" xmlns:x="http://schemas.microsoft.com/winfx/2006/xaml" xmlns:sys="clr-namespace:System;assembly=mscorlib" Title="Window1" Height="300" Width="300" xmlns:c1chart="http://schemas.componentone.com/xaml/c1chart" Loaded="Window_Loaded"> <Grid> <Grid.Resources> <Style x:Key="sstyle" TargetType="{x:Type c1chart:PlotElement}"> <Setter Property="StrokeThickness" Value="1" /> <Setter Property="Canvas.ZIndex" Value="0" /> <Style.Triggers> <EventTrigger RoutedEvent="c1chart:PlotElement.MouseDown"> <BeginStoryboard> <Storyboard> <Int32Animation Storyboard.TargetProperty="(Panel.ZIndex)" To="1" /> <DoubleAnimation Storyboard.TargetProperty="StrokeThickness" To="4" Duration="0:0:0.3" AutoReverse="True" RepeatBehavior="Forever" /> </Storyboard> </BeginStoryboard> </EventTrigger> <EventTrigger RoutedEvent="c1chart:PlotElement.MouseLeave"> <BeginStoryboard> <Storyboard> <DoubleAnimation Storyboard.TargetProperty="StrokeThickness" /> <Int32Animation Storyboard.TargetProperty="(Panel.ZIndex)" /> </Storyboard> </BeginStoryboard> </EventTrigger> </Style.Triggers> </Style> </Grid.Resources> <c1chart:C1Chart Margin="0" Name="c1Chart1" ChartType="Column"> <c1chart:C1Chart.Data> <c1chart:ChartData> <c1chart:ChartData.ItemNames>P1 P2 P3 P4 P5</c1chart:ChartData.ItemNames> <c1chart:DataSeries SymbolStyle="{StaticResource sstyle}" Values="20 22 19 24 25" /> <c1chart:DataSeries SymbolStyle="{StaticResource sstyle}" Values="8 12 10 12 15" /> </c1chart:ChartData> </c1chart:C1Chart.Data> </c1chart:C1Chart> </Grid> </Window> |
|
This Topic Illustrates the Following:
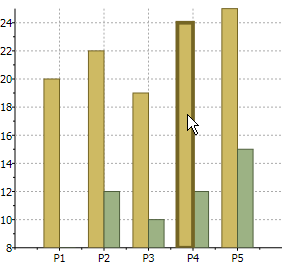
Click on any of the columns and notice the animation around the borders of the rectangles: