Chart for WPF and Silverlight allows you to create custom grouping and aggregation functions with the AggregateGroupSelector property. The following example will walk you through creating a custom aggregation function based on category. You'll start in the MainWindow.xaml page of your WPF or Silverlight application.
First, you'll need to add a C1Chart control to your application and name it "chart":
| XAML |
Copy Code
|
|---|---|
<c1chart:C1Chart Name="chart"></c1chart:C1Chart>
|
|
Then, add a general button control and set the Click event as follows:
| XAML |
Copy Code
|
|---|---|
<Button Content="New Data" Width="100" Click="Button_Click" /> |
|
Switch to code view. Add the following using statement to the top of your page:
| C# |
Copy Code
|
|---|---|
using C1.WPF.C1Chart; //OR using C1.Silverlight.Chart; |
|
Then, edit the MainWindow() constructor so that it resembles the following:
| C# |
Copy Code
|
|---|---|
public MainWindow()
        {
            InitializeComponent();
            CreateSampleChart();
        }
|
|
Add the CreateSampleChart() method:
| C# |
Copy Code
|
|---|---|
void CreateSampleChart()
 {

 }
|
|
Within the CreateSampleChart() method, create a List object that contains the item names:
| C# |
Copy Code
|
|---|---|
var keys = new List<string> { "oranges", "apples", "lemons", "grapes" }; |
|
Then, add a bound DataSeries:
| C# |
Copy Code
|
|---|---|
for (int i = 0; i < 2; i++) { var ds = new DataSeries() { ItemsSource = SampleItem.CreateSampleData(40), ValueBinding = new Binding() { Path = new PropertyPath("Value") }, Aggregate = Aggregate.Sum, Label = "s" + i }; |
|
Add the AggregateGroupSelector function and the code that will add the DataSeries to your chart. Here, the AggregateGroupSelector function will return the Item Names from the SampleItem class we'll add next:
| C# |
Copy Code
|
|---|---|
ds.AggregateGroupSelector = (x, y, o) =>
         {
             // index from categories list
             return keys.IndexOf(((SampleItem)o).Name);
         };
         chart.Data.Children.Add(ds);
     }
     chart.Data.ItemNames = keys;
 }
|
|
The Button_Click event will clear the old data before it calls new, random data each time a user clicks the button:
| C# |
Copy Code
|
|---|---|
private void Button_Click(object sender, RoutedEventArgs e) { chart.Data.Children.Clear(); CreateSampleChart(); } |
|
Finally, add the SampleItem class. This will create the random data for your chart control:
| C# |
Copy Code
|
|---|---|
public class SampleItem { public string Name { get; set; } public double Value { get; set; } static Random rnd = new Random(); public static SampleItem[] CreateSampleData(int cnt) { var names = new string[] { "oranges", "apples", "lemons", "grapes" }; var array = new SampleItem[cnt]; for (int i = 0; i < cnt; i++) { array[i] = new SampleItem() { Value = rnd.Next(1, 10), Name = names[rnd.Next(names.Length)] }; } return array; } } } } |
|
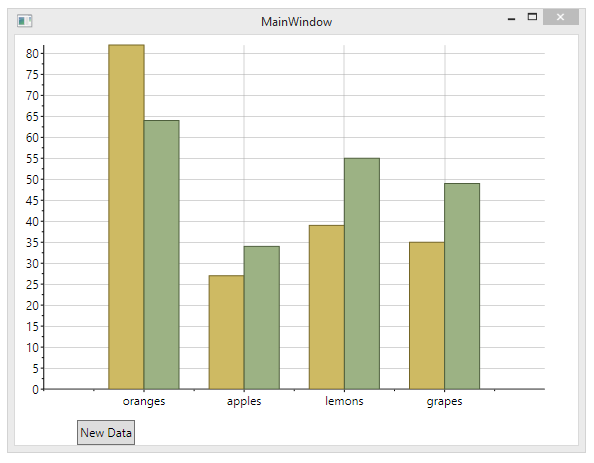
The code and markup above results in an application that resembles the following image: