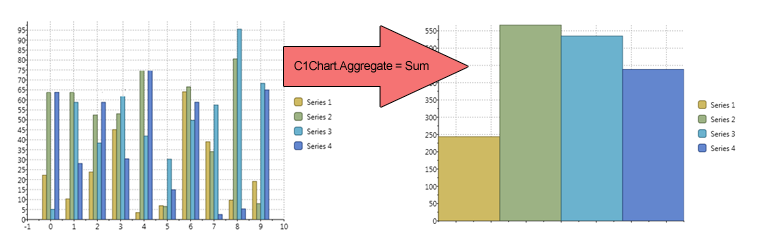
The C1Chart control can automatically group and aggregate each data series into a single plotted value by just setting one property. This action combines all values for a single series into one value using one of the supported aggregation functions (sum, average, min, max, variance, standard deviation, etc).
Just set the Aggregate property on the C1Chart control to apply the grouping for all series. For example, if we have a chart with four data series and we set the Aggregate property to Sum, the result would look something like this:
The markup used to Aggregate the DataSeries resembles the following:
| XAML |
Copy Code
|
|---|---|
<c1chart:C1Chart x:Name="chart0" Height="350" Width="450" ChartType="Column" Palette="Solstice" Foreground="Black" > <!-- Populate the chart with three series --> <c1chart:C1Chart.Data> <c1chart:ChartData > <c1chart:ChartData.Children> <c1chart:DataSeries Label="Revenue" Aggregate="Sum" Values="1200, 1205, 400, 1410" ></c1chart:DataSeries> <c1chart:DataSeries Label="Expense" Aggregate="Sum" Values="400, 300, 300, 210" ></c1chart:DataSeries> <c1chart:DataSeries Label="Profit" Aggregate="Sum" Values="790, 990, 175, 1205" ></c1chart:DataSeries> </c1chart:ChartData.Children> </c1chart:ChartData> </c1chart:C1Chart.Data> </c1chart > |
|