The C1Chart control allows custom aggregation on any data series. By defining your own custom function for the AggregateGroupSelector property, the C1Chart control can group your data however you would like. For instance, you can provide grouping on a date field to summarize values per month or year. You can even set up your own value ranges and categories to group data points.
This topic assumes that you have created a C1Chart control in XAML and have named it "c1Chart1". For information on creating a control in XAML, see the Quick Start or the Concepts and Main Properties topic.
In order to create a custom aggregation function, you first need to create data to aggregate. You can create a simple business object with two properties: Value (double) and Date (DateTime). In the following example, this business object is called SampleItem. For reference, you can find this at the bottom of this topic.
Create an ObservableCollection of random data:
| C# |
Copy Code
|
|---|---|
Random rnd = new Random(); ObservableCollection<SampleItem> _items = new ObservableCollection<SampleItem>(); for(int i = 0; i < 400; i++) { _items.Add(new SampleItem { Value = rnd.Next(0, 100), Date = DateTime.Now.AddDays(i) }); } |
|
Then, you bind your XYDataSeries to the collection of items:
| C# |
Copy Code
|
|---|---|
// configure data series var ds = new XYDataSeries() { ItemsSource = _items, ValueBinding = new Binding { Path = new PropertyPath("Value") }, XValueBinding = new Binding { Path = new PropertyPath("Date") }, Aggregate = Aggregate.Sum, AggregateGroupSelector = GroupSelectorByDate, Label = "Sales" }; |
|
You've set two key properties in the code above: Aggregate and AggregateGroupSelector. The Aggregate property determines the function used to aggregate chart data.The AggregateGroupSelector property determines the function that will provide the grouping selector key to the data series. Before you set the custom function, though, add the series to the chart and configure it to display dates along the X-axis. You'll also set the X-axis to IsTime so that the dates display properly:
| C# |
Copy Code
|
|---|---|
// configure chart c1Chart1.BeginUpdate(); c1Chart1.ChartType = ChartType.Column; // add data series c1Chart1.Data.Children.Add(ds); // use time axis with specific formatting c1Chart1.View.AxisX.IsTime = true; c1Chart1.View.AxisX.AnnoFormat = "yyyy"; c1Chart1.View.AxisX.UseExactLimits = true; // apply some style c1Chart1.View.AxisX.MajorGridStrokeThickness = 0; c1Chart1.View.AxisY.MajorGridFill = new SolidColorBrush(Colors.LightGray); c1Chart1.EndUpdate(); |
|
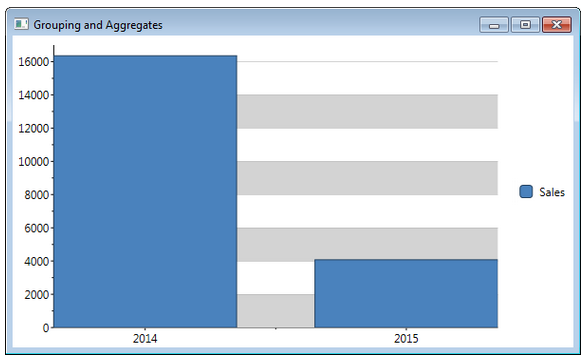
Note that when you're displaying dates along the X-axis, you have to set the IsTime property to True. You'll be grouping by year, so notice that the AnnoFormat property has been set to display the full year.
The following code defines the GroupSelectorByDate function. The function will be called for each data point in your chart and determines the group in which the data belongs.
| C# |
Copy Code
|
|---|---|
double GroupSelectorByDate(double x, double y, object o) { // return year as double DateTime dt = x.FromOADate(); // to group by year we return the dates year // also set the AnnoFormat to "yyyy" return new DateTime(dt.Year, 1, 1).ToOADate(); } |
|
The group selector function will always have three parameters and will always return a double. Data points that belong in the same group should return the same value from this function. Since you're grouping by year, the function returns a new DateTime value set to the first date of the year. Every data point that occurs in 2014 will return the same date value (as a double) from this function, and therefore be put into the same group.
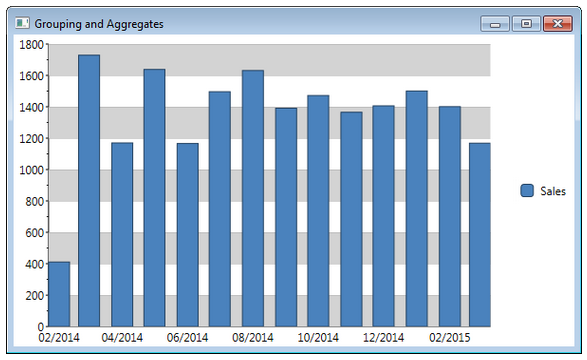
Now, if you also want to group by month, then you only have to modify two lines of code:
| C# |
Copy Code
|
|---|---|
double GroupSelectorByDate(double x, double y, object o) { // return year as double DateTime dt = x.FromOADate(); // to group by month we return the date's year and month return new DateTime(dt.Year, dt.Month, 1).ToOADate(); } |
|
You also have to change the AnnoFormat to properly display the month:
| C# |
Copy Code
|
|---|---|
c1Chart1.View.AxisX.AnnoFormat = "MM/yyyy";
|
|
The resulting chart will resemble the following image:
For reference, this is the SampleItem class:
| C# |
Copy Code
|
|---|---|
public class SampleItem { public double Value { get; set; } public DateTime Date { get; set; } } |
|