By default, if there is a hole(double.NaN) in data values chart just skips the value and draws line to next valid data point.
To change this behavior and show the gaps at the hole values, set Display = ShowNaNGap.
For example, the following XAML code includes specified holes in the DataSeries:
| XAML |
Copy Code
|
|---|---|
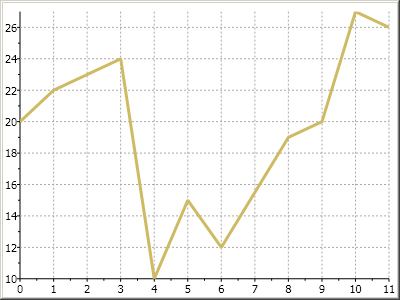
<c1chart:C1Chart Name="c1Chart1" ChartType="Line"> <c1chart:C1Chart.Data> <c1chart:ChartData> <c1chart:DataSeries Values="20 22 NaN 24 15 NaN 27 26" ConnectionStrokeThickness="3" /> </c1chart:ChartData> </c1chart:C1Chart.Data> </c1chart:C1Chart> |
|
The chart appears similar to the following without the Display property set:
To show a gap between the chart lines in a Line chart you can set the Display property to ShowNaNGap like the following:
| Visual Basic |
Copy Code
|
|---|---|
Me.C1Chart1.Data.Children(1).Display = C1.WPF.C1Chart.SeriesDisplay.ShowNaNGap |
|
| C# |
Copy Code
|
|---|---|
this.C1Chart1.Data.Children[1].Display = C1.WPF.C1Chart.SeriesDisplay.ShowNaNGap;
|
|
The line chart will display a gap between the chart lines, similar to the following:
